Visualize key liquidation levels that whales are likely to target and stay on the right side of the trade.
Liquidity Tools in trading serve the purpose of identifying and managing potential liquidation points for leveraged long and short positions. Our Liquidation Engine – Delta & Levels utilizes advance models that analyze volume anomalies to identify vulnerable price points where highly leveraged positions are vulnerable to being liquidated. This allows traders to anticipate and prepare for price levels that may trigger a cascade of liquidations in the market. Understanding these levels allow traders to make informed decisions to mitigate risk and optimize their trading strategies in the dynamic and fast-paced world of leveraged markets.
HOW IT WORKS
Drag the slider to reveal how whales consistently send price to key liquidity pockets before reversing.
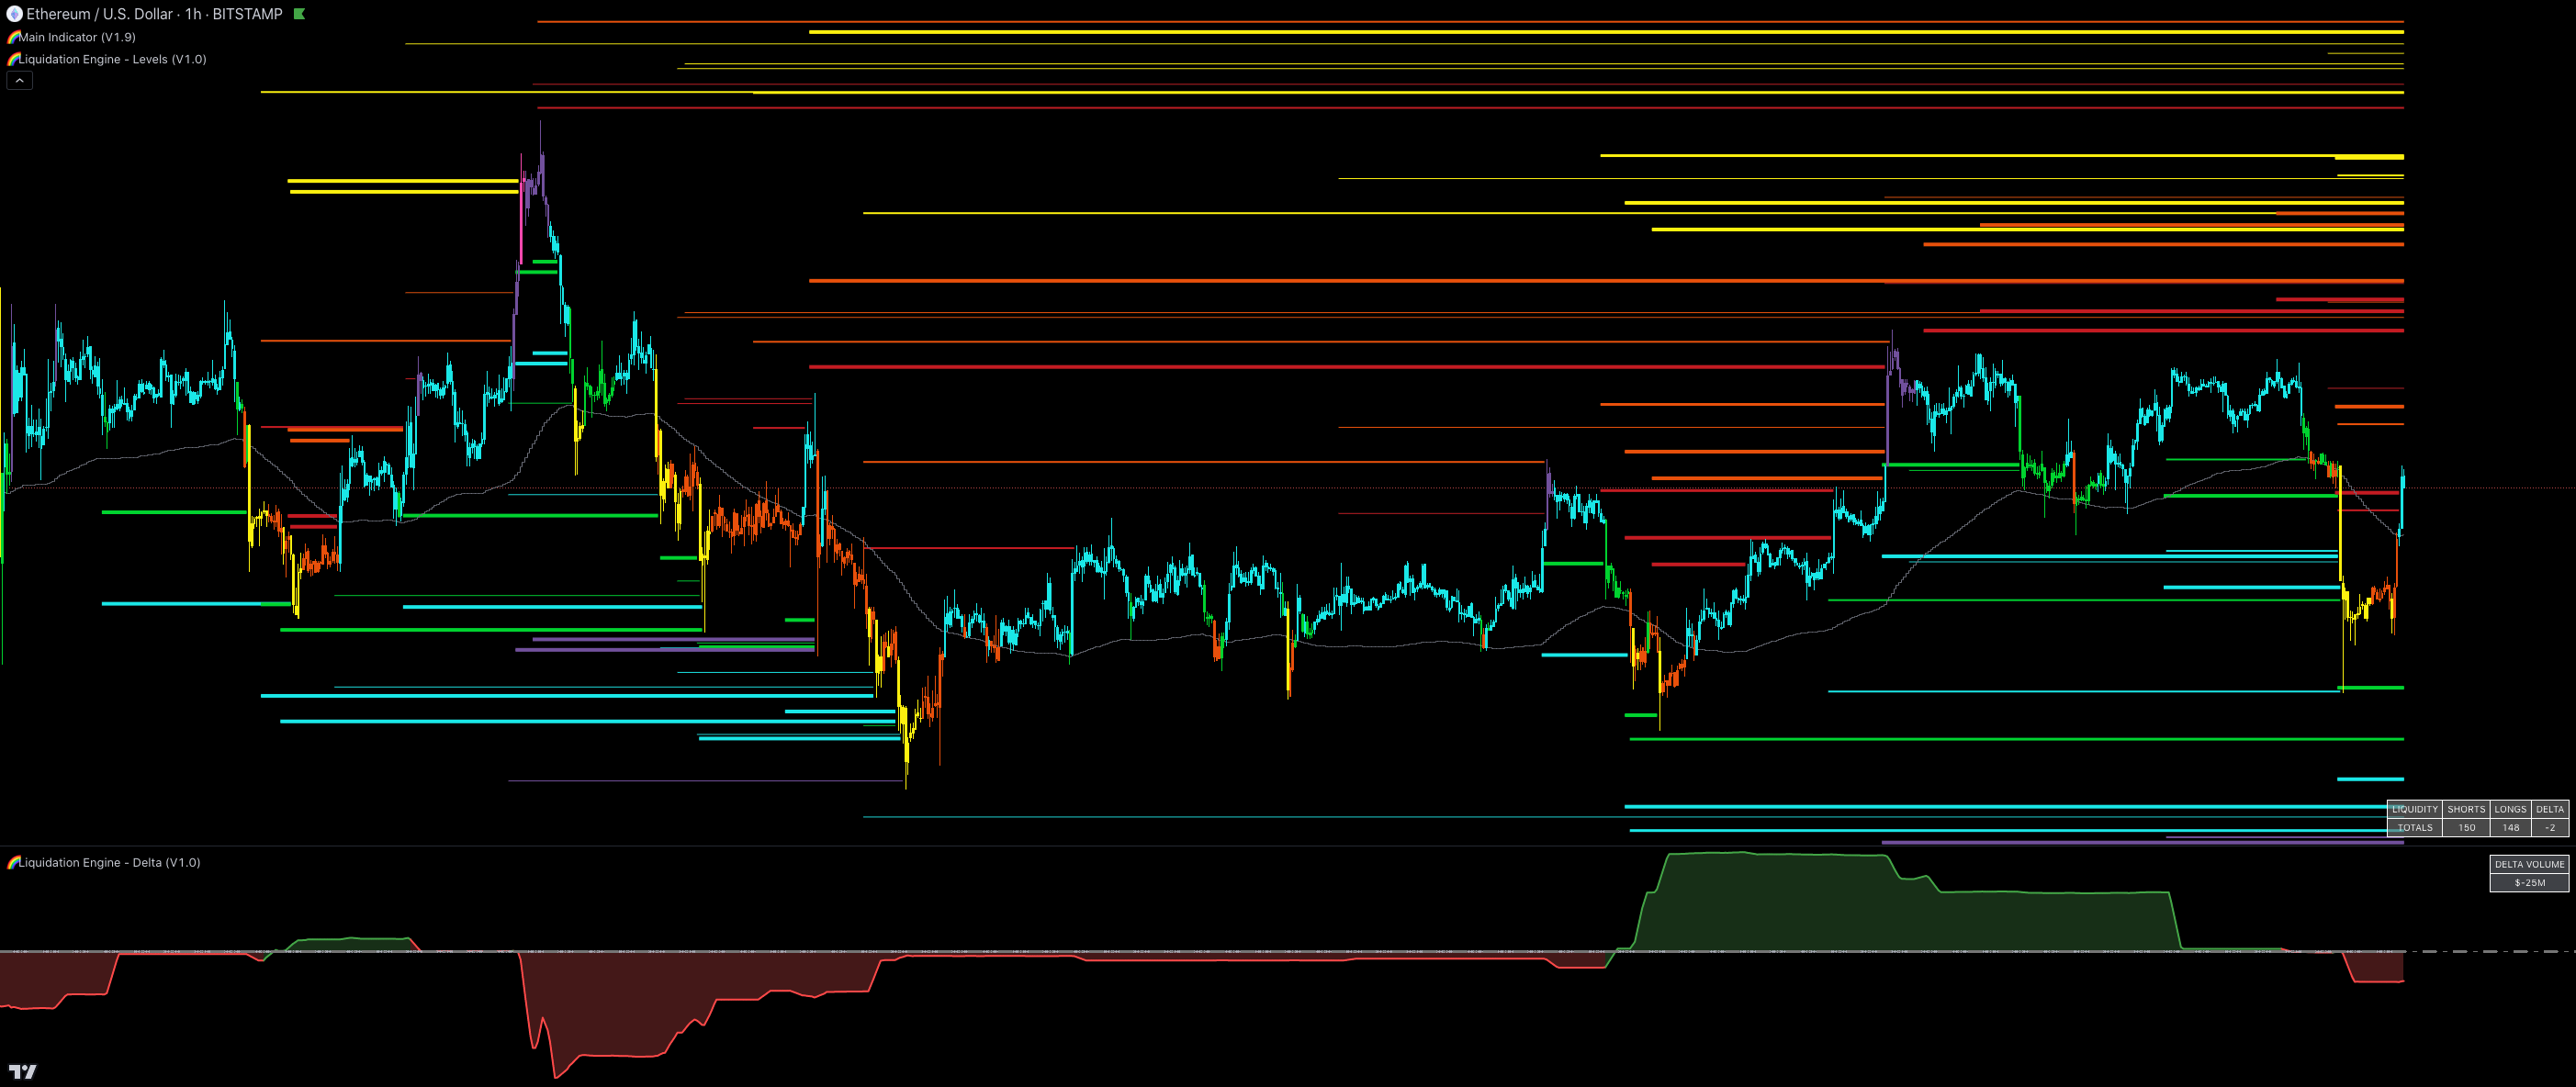
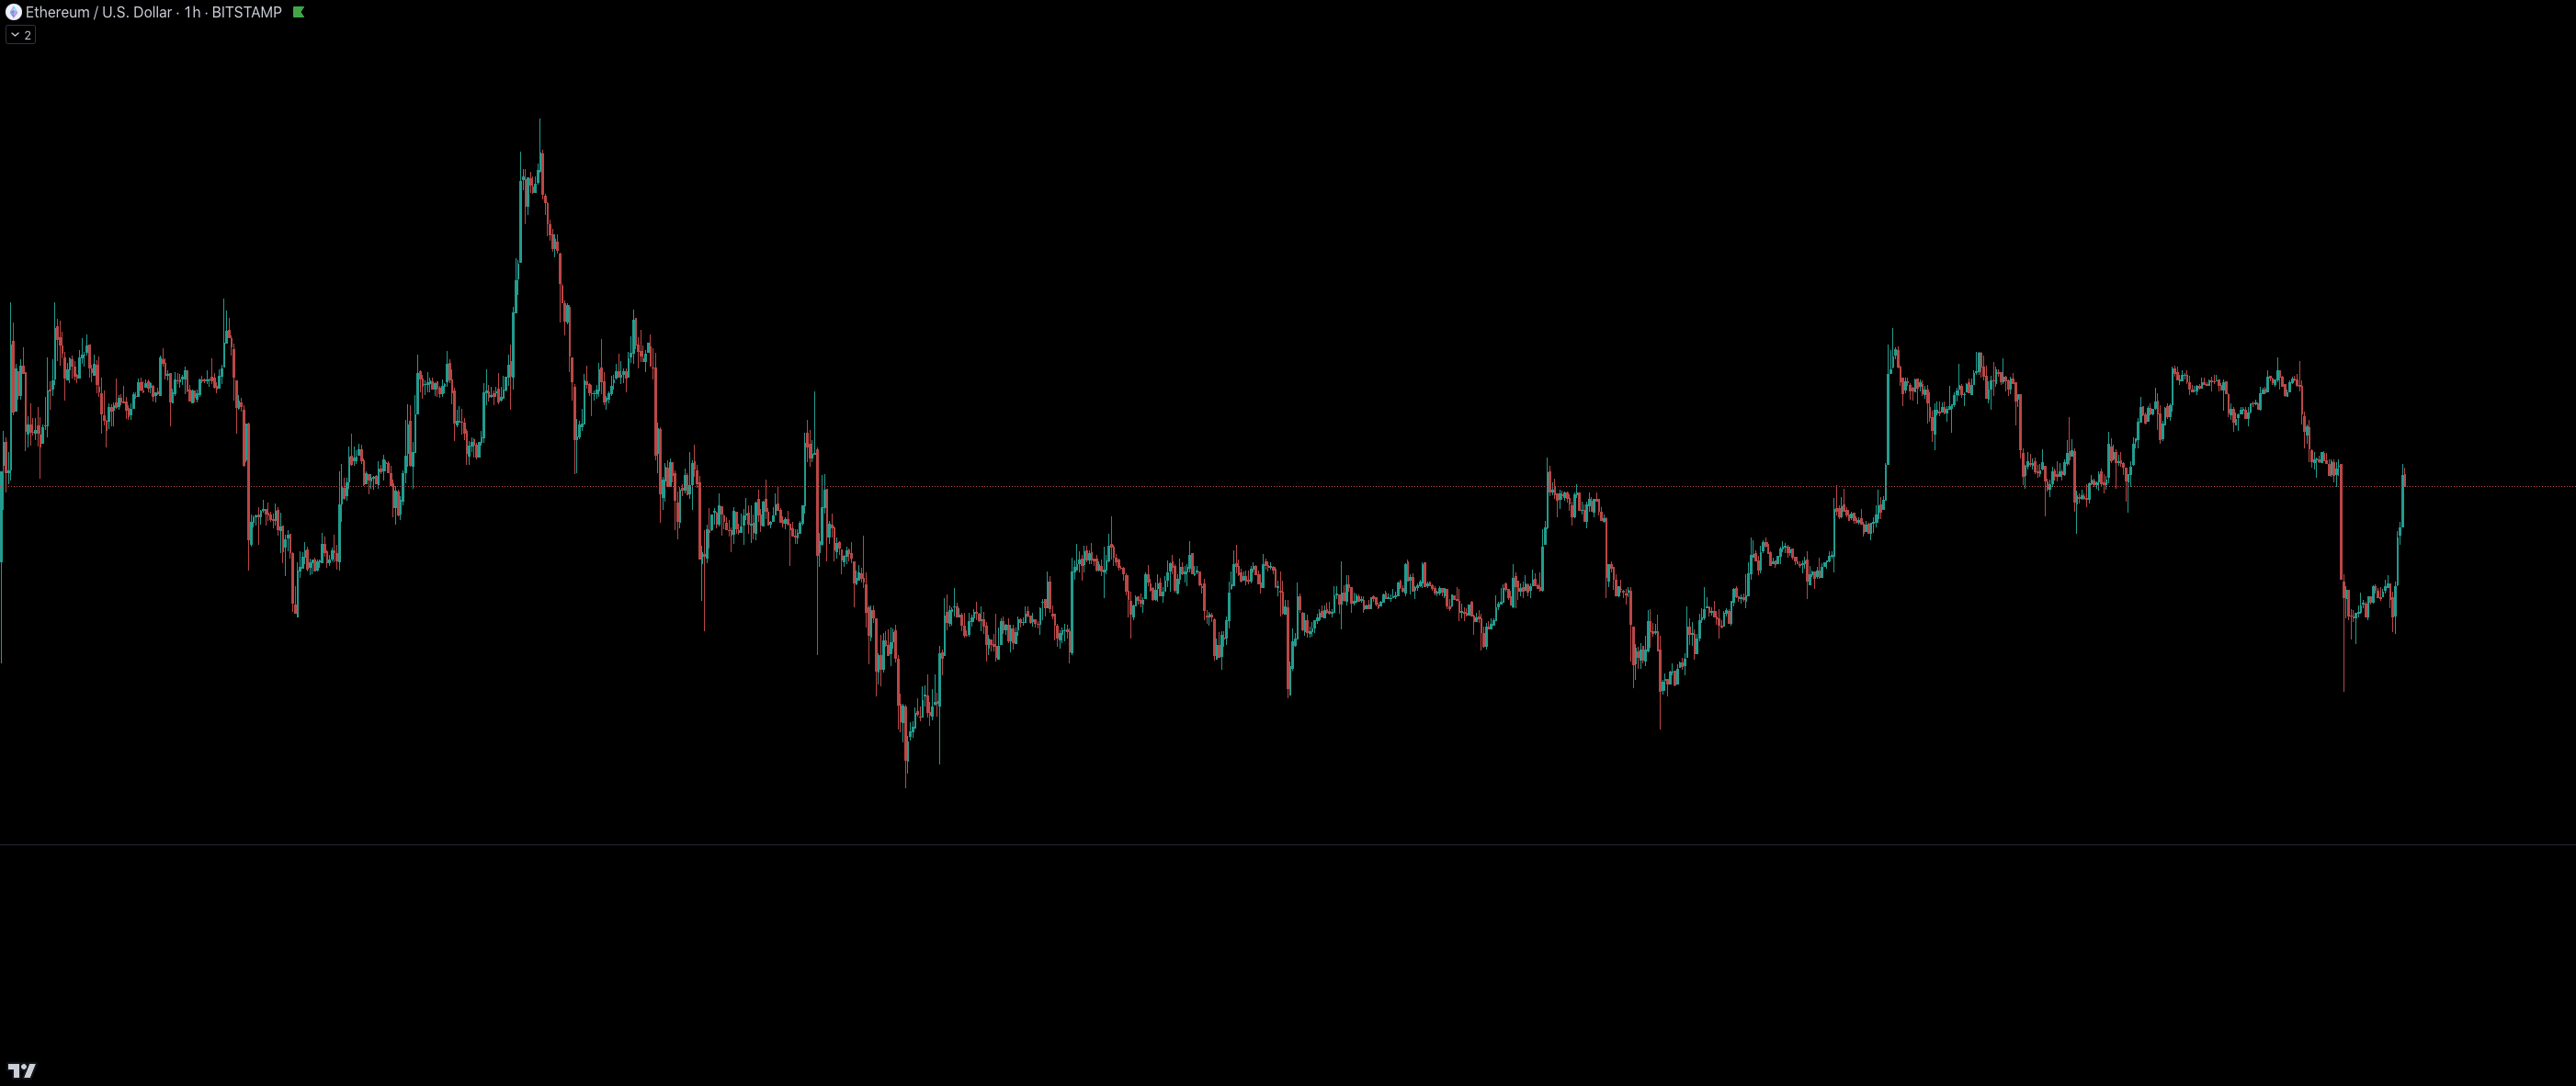
Indicators on this chart: Main Indicator and Liquidation Engine Levels + Delta
COLOR CODED LIQUIDATION LEVELS
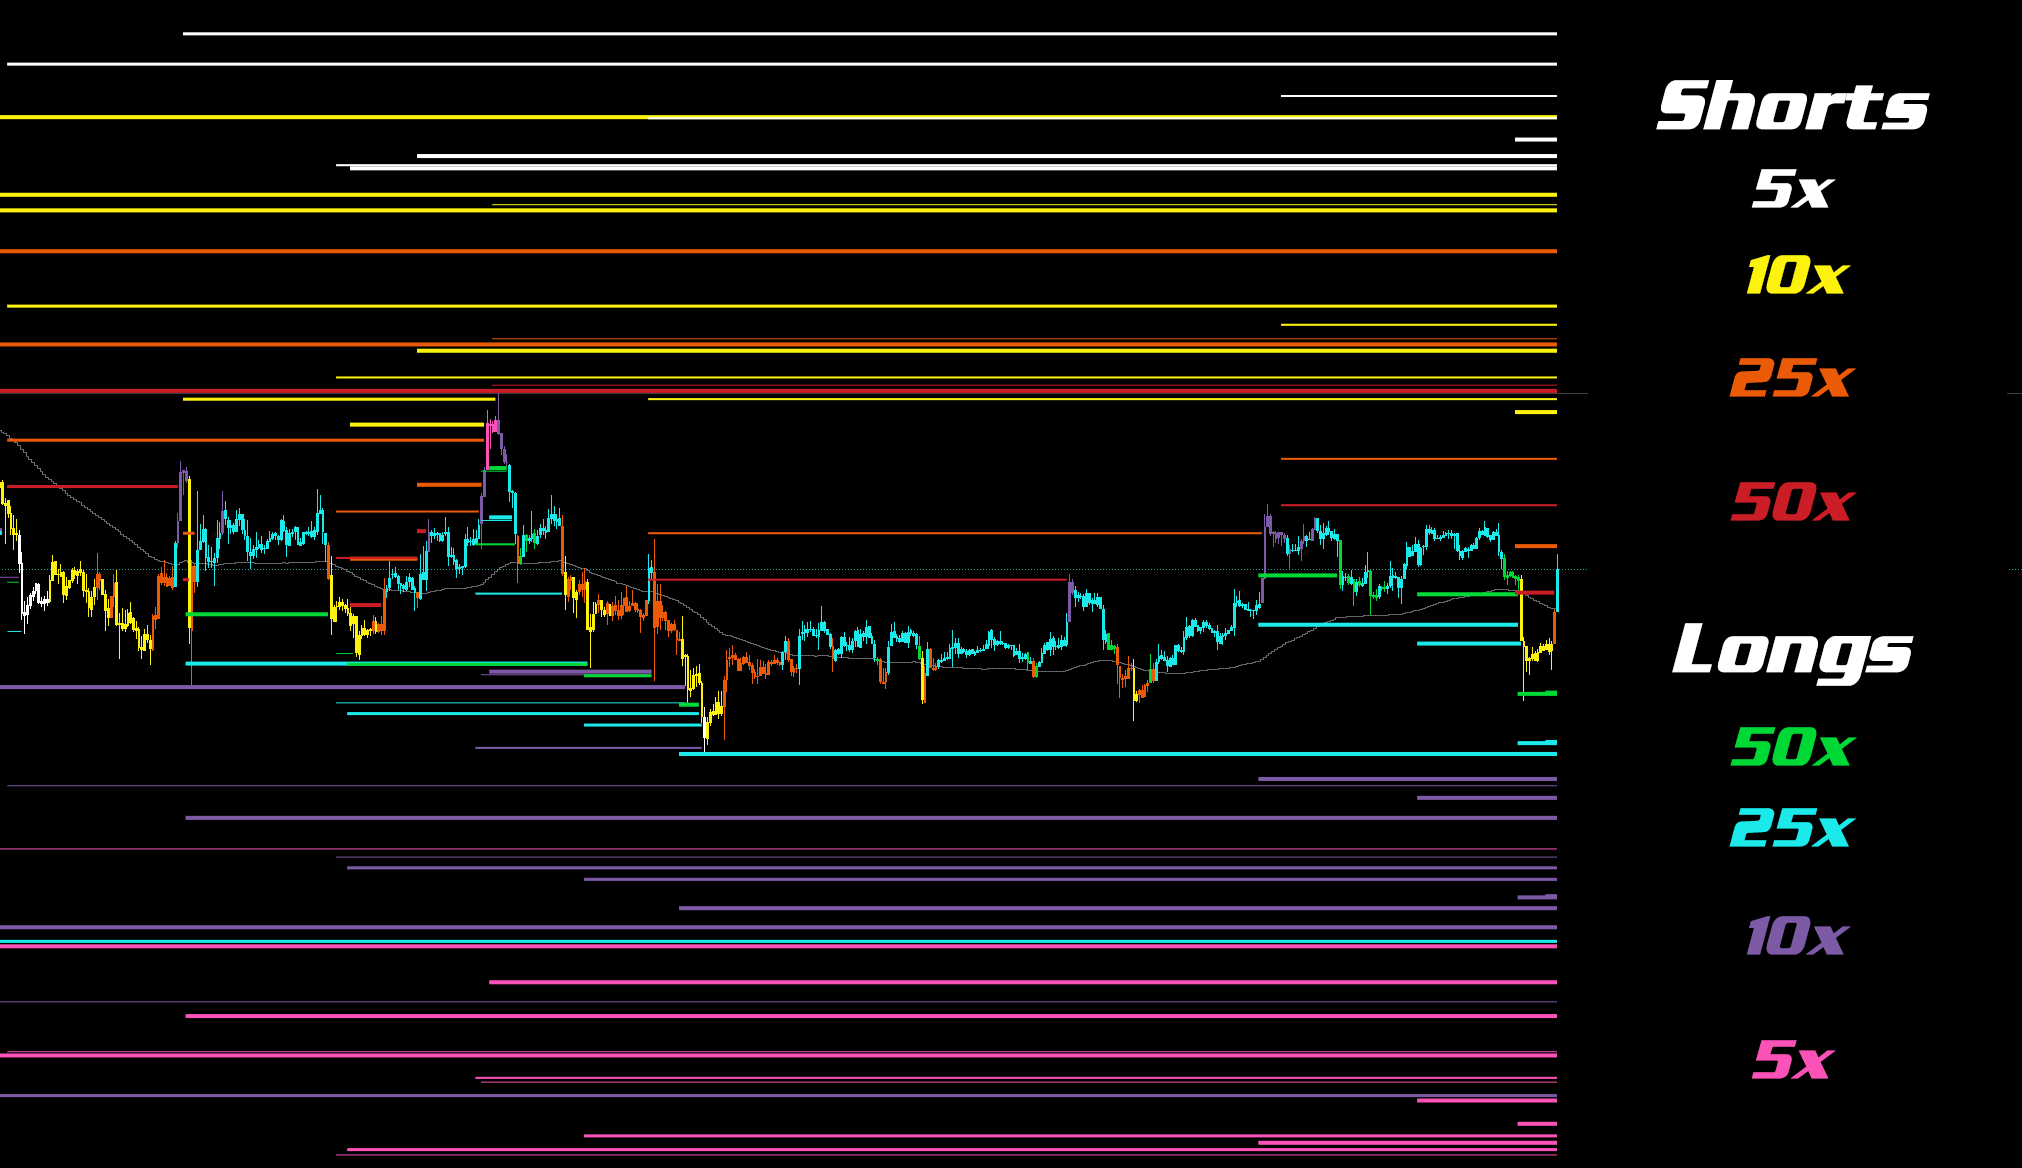
The Liquidation Engine – Delta & Levels has fully customizable color coding for calculating the varying levels of liquidity. The Liquidation Engine – Delta & Levels calculates these leveraged positions based on four levels: 5X, 10X, 25X and 50X. Each of these levels can be displayed with a unique color.
FIND IMBALANCES BETWEEN LONGS & SHORTS
The Liquidation Engine – Delta & Levels pairs perfectly with the Main Indicator by highlighting liquidity targets and showing momentum shifts. This this deadly combination for locating entries & exits, calculating leverage and stop loss placements for more consistent execution. The Liquidity Engine also calculates the estimated delta dollar amount between Longs and Shorts and displays this data on a second pane.
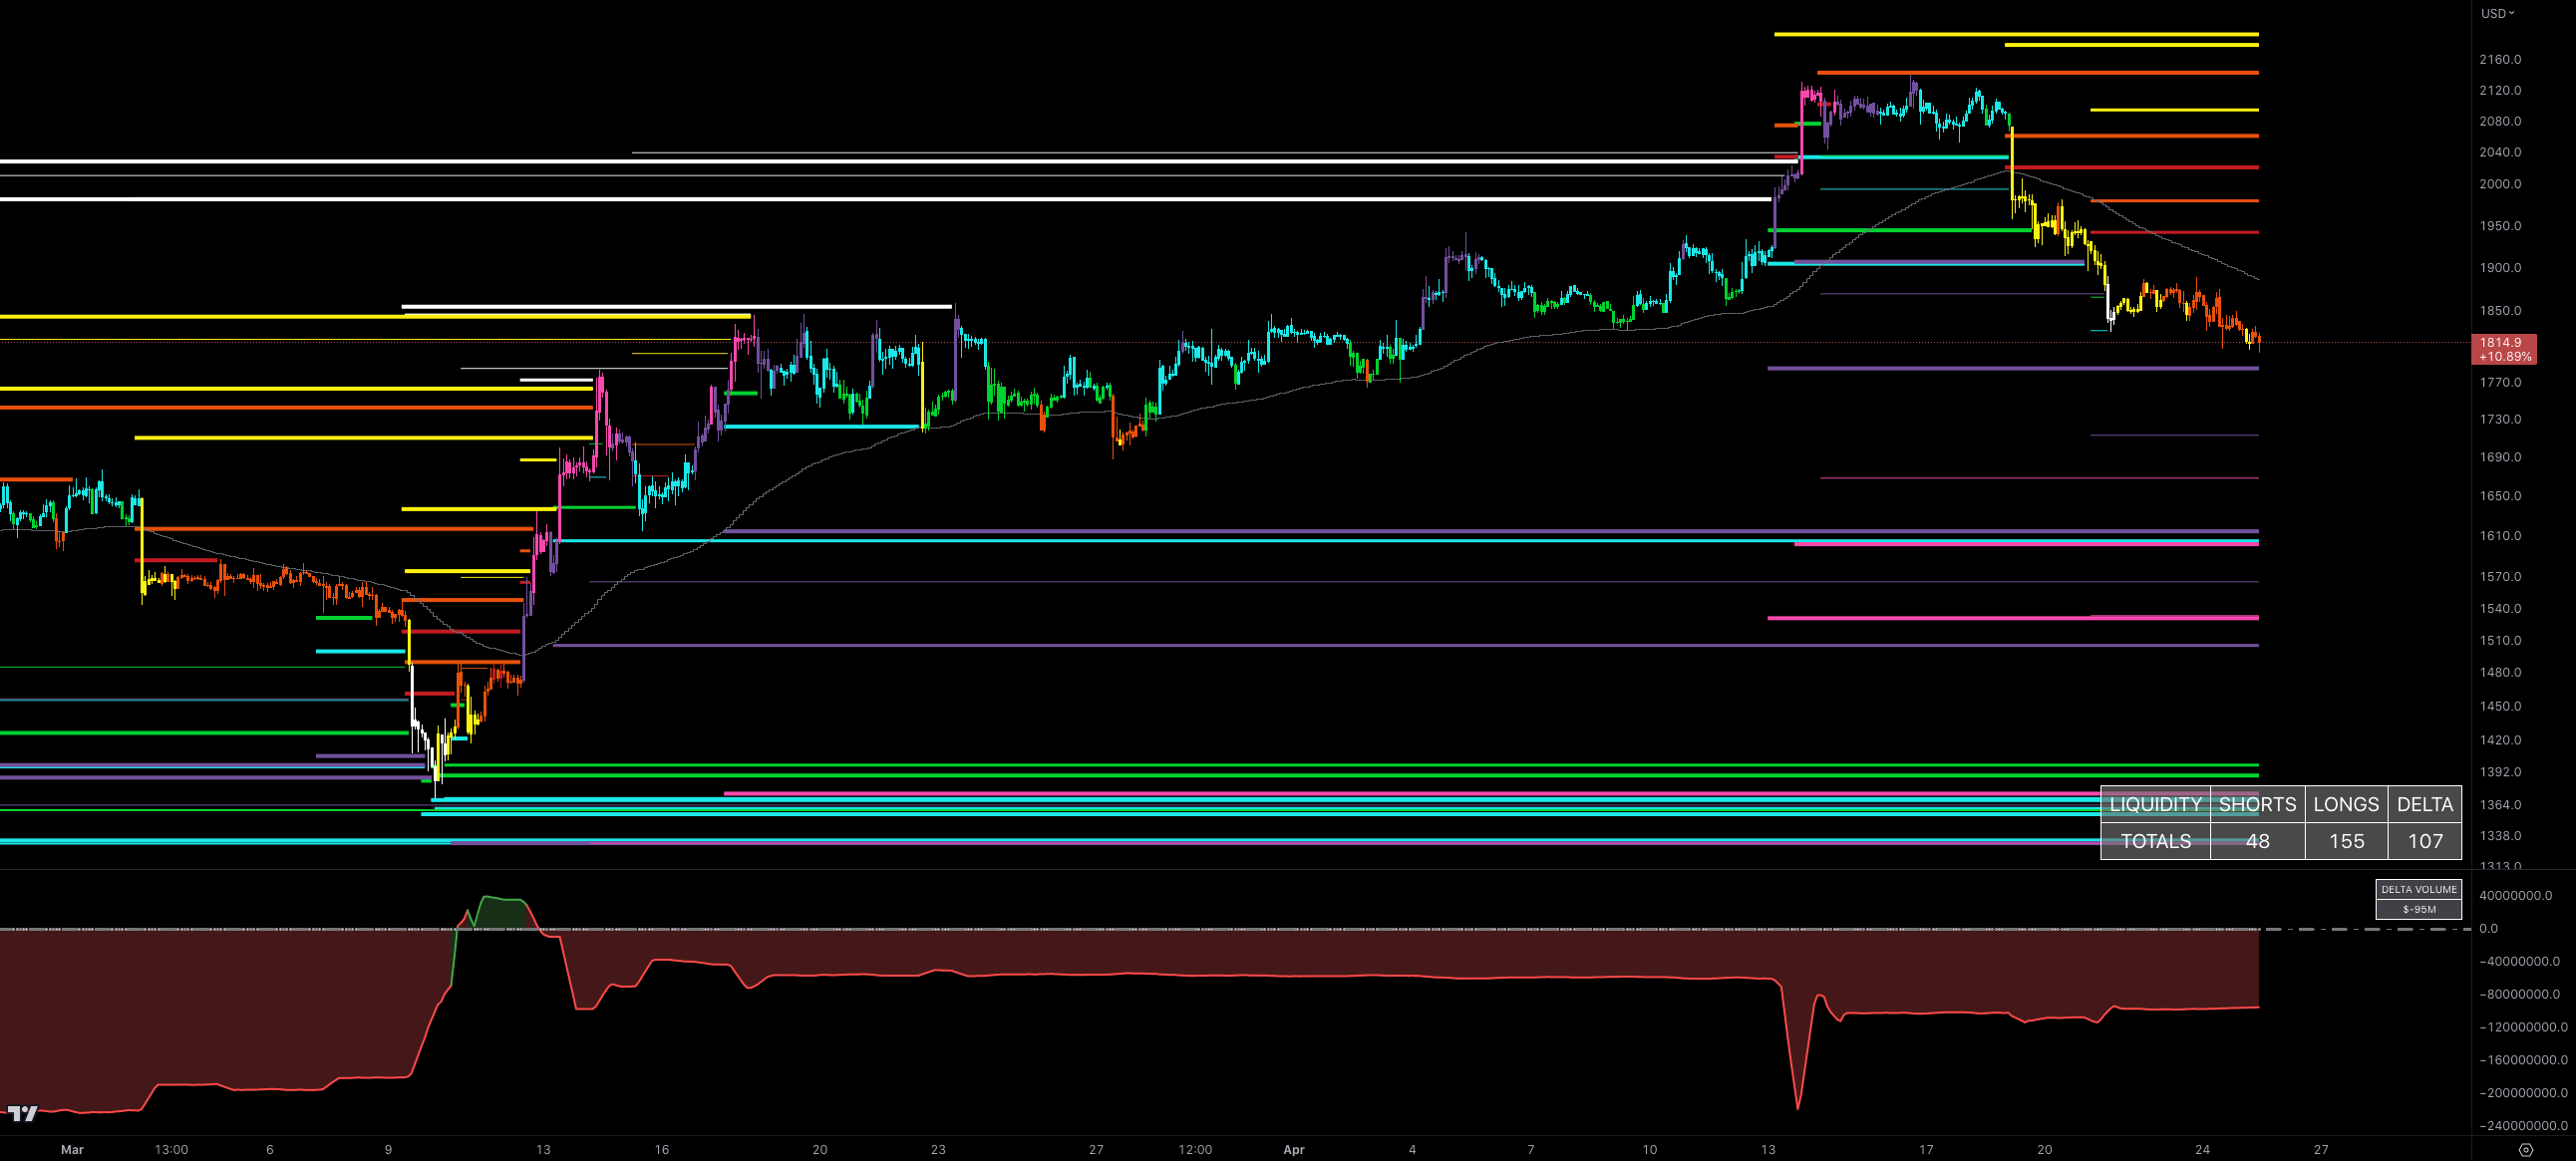
Short liquidity taken and a
bearish candle color rotation begins.
Long liquidity taken and bullish
candle color rotation begins.
Delta between long and shorts
begin aggressively flipping bullish.
Extreme Delta shift between longs and
shorts ahead of shifting price action.
Total number of short and long liquidation points
and the delta between the two sides.
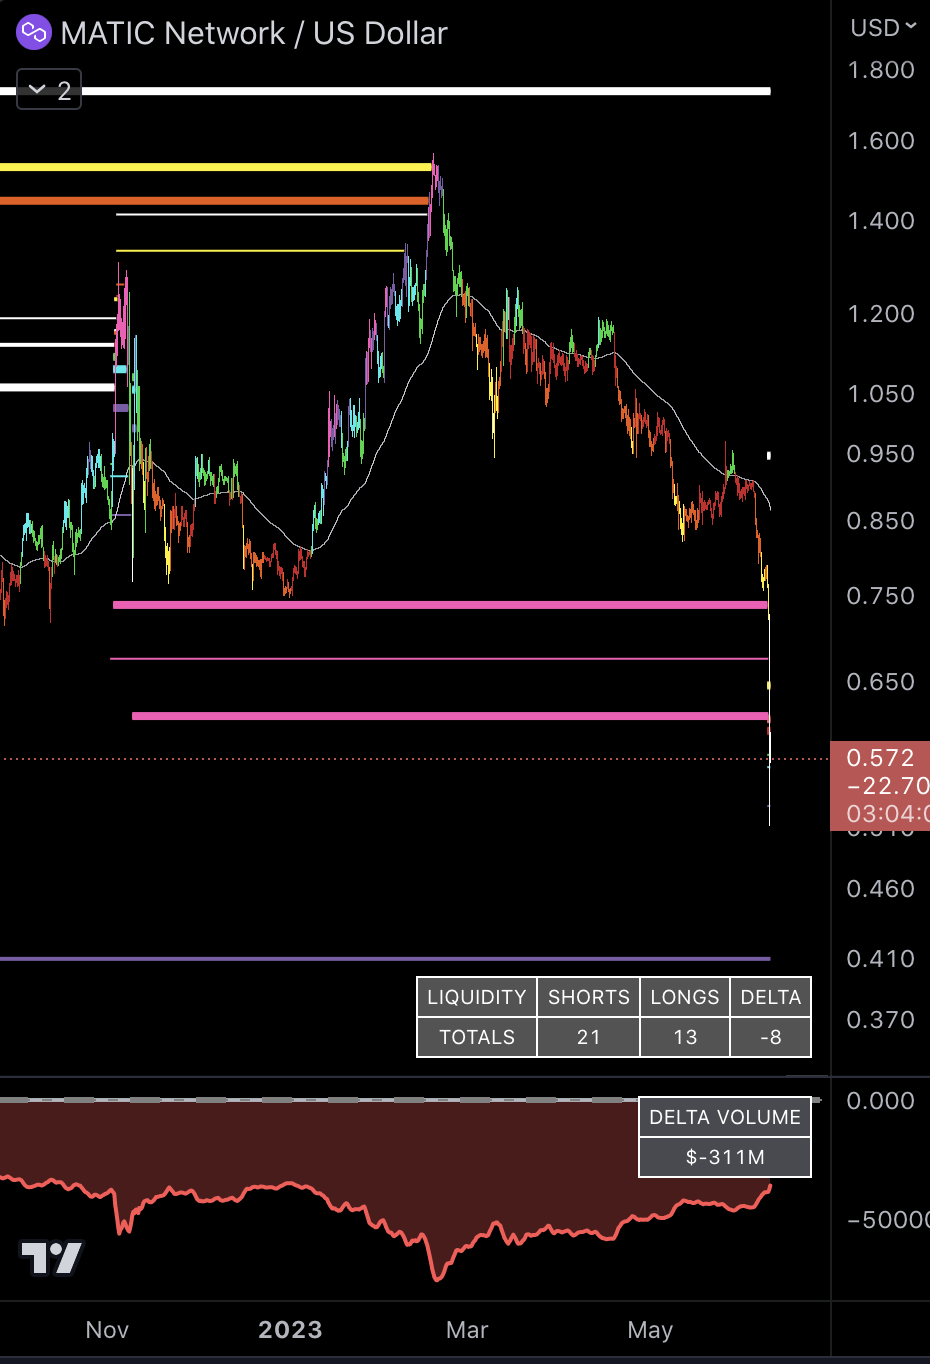
Short liquidity taken.
Bearish rotation begins.
Long liquidity taken.
Bullish color rotation begins.
Delta between long & shorts
aggressively flipping bullish.
Total number of short
and long liquidation points
and the delta between the two.
Support lost &
deep liquidity targets taken.
FULLY CUSTOMIZABLE SETTINGS
Complete control to adjust the sensitivity, colors, and much more.
Start Trading with
Liquidation Engine - Delta & Levels Now
The only indicator system that shows the signal in REAL-TIMEto give you an edge on the market.
JOIN US FOR ONLY $10
$10 for your first 30 days. Renews monthly at full price. Cancel anytime.

PREMIUM
SUBSCRIPTION
Includes All Indicators PLUS Bot & Liquidity Engine
BEATS GETTING LIQUIDATED
-
LIQUIDATION ENGINE - DELTA & LEVELS
-
RUNNER BOT
-
RAINBOW TRENDS MAIN INDICATOR
-
MACHINE LEARNING REVERSION BANDS
-
LIQUIDATION LEVELS
-
MAYER MULTIPLE
-
CHANNEL WALKER
-
SPLIT VOLUME
-
COINBASE VS BINANCE PREMIUM
-
MALI 9 | 13 | 00 PIVOTS & STD LIQUIDATION LEVELS
-
BTC FUNDING CANDLES & FUNDING INDICATOR
-
ANCHORED OBV
-
CUSTOM CLOUDS, RSI DIVERGENCES, HMA & GOLDEN POCKET

PREMIUM
SUBSCRIPTION
Includes All Indicators PLUS Bot & Liquidity Engine
$1,200 VALUE
20% OFF
-
LIQUIDATION ENGINE - DELTA & LEVELS
-
RUNNER BOT
-
RAINBOW TRENDS MAIN INDICATOR
-
MACHINE LEARNING REVERSION BANDS
-
LIQUIDATION LEVELS
-
MAYER MULTIPLE
-
CHANNEL WALKER
-
SPLIT VOLUME
-
COINBASE VS BINANCE PREMIUM
-
MALI 9 | 13 | 00 PIVOTS & STD LIQUIDATION LEVELS
-
BTC FUNDING CANDLES & FUNDING INDICATOR
-
ANCHORED OBV
-
CUSTOM CLOUDS, RSI DIVERGENCES, HMA & GOLDEN POCKET
MORE PREMIUM INDICATORS & BOTS
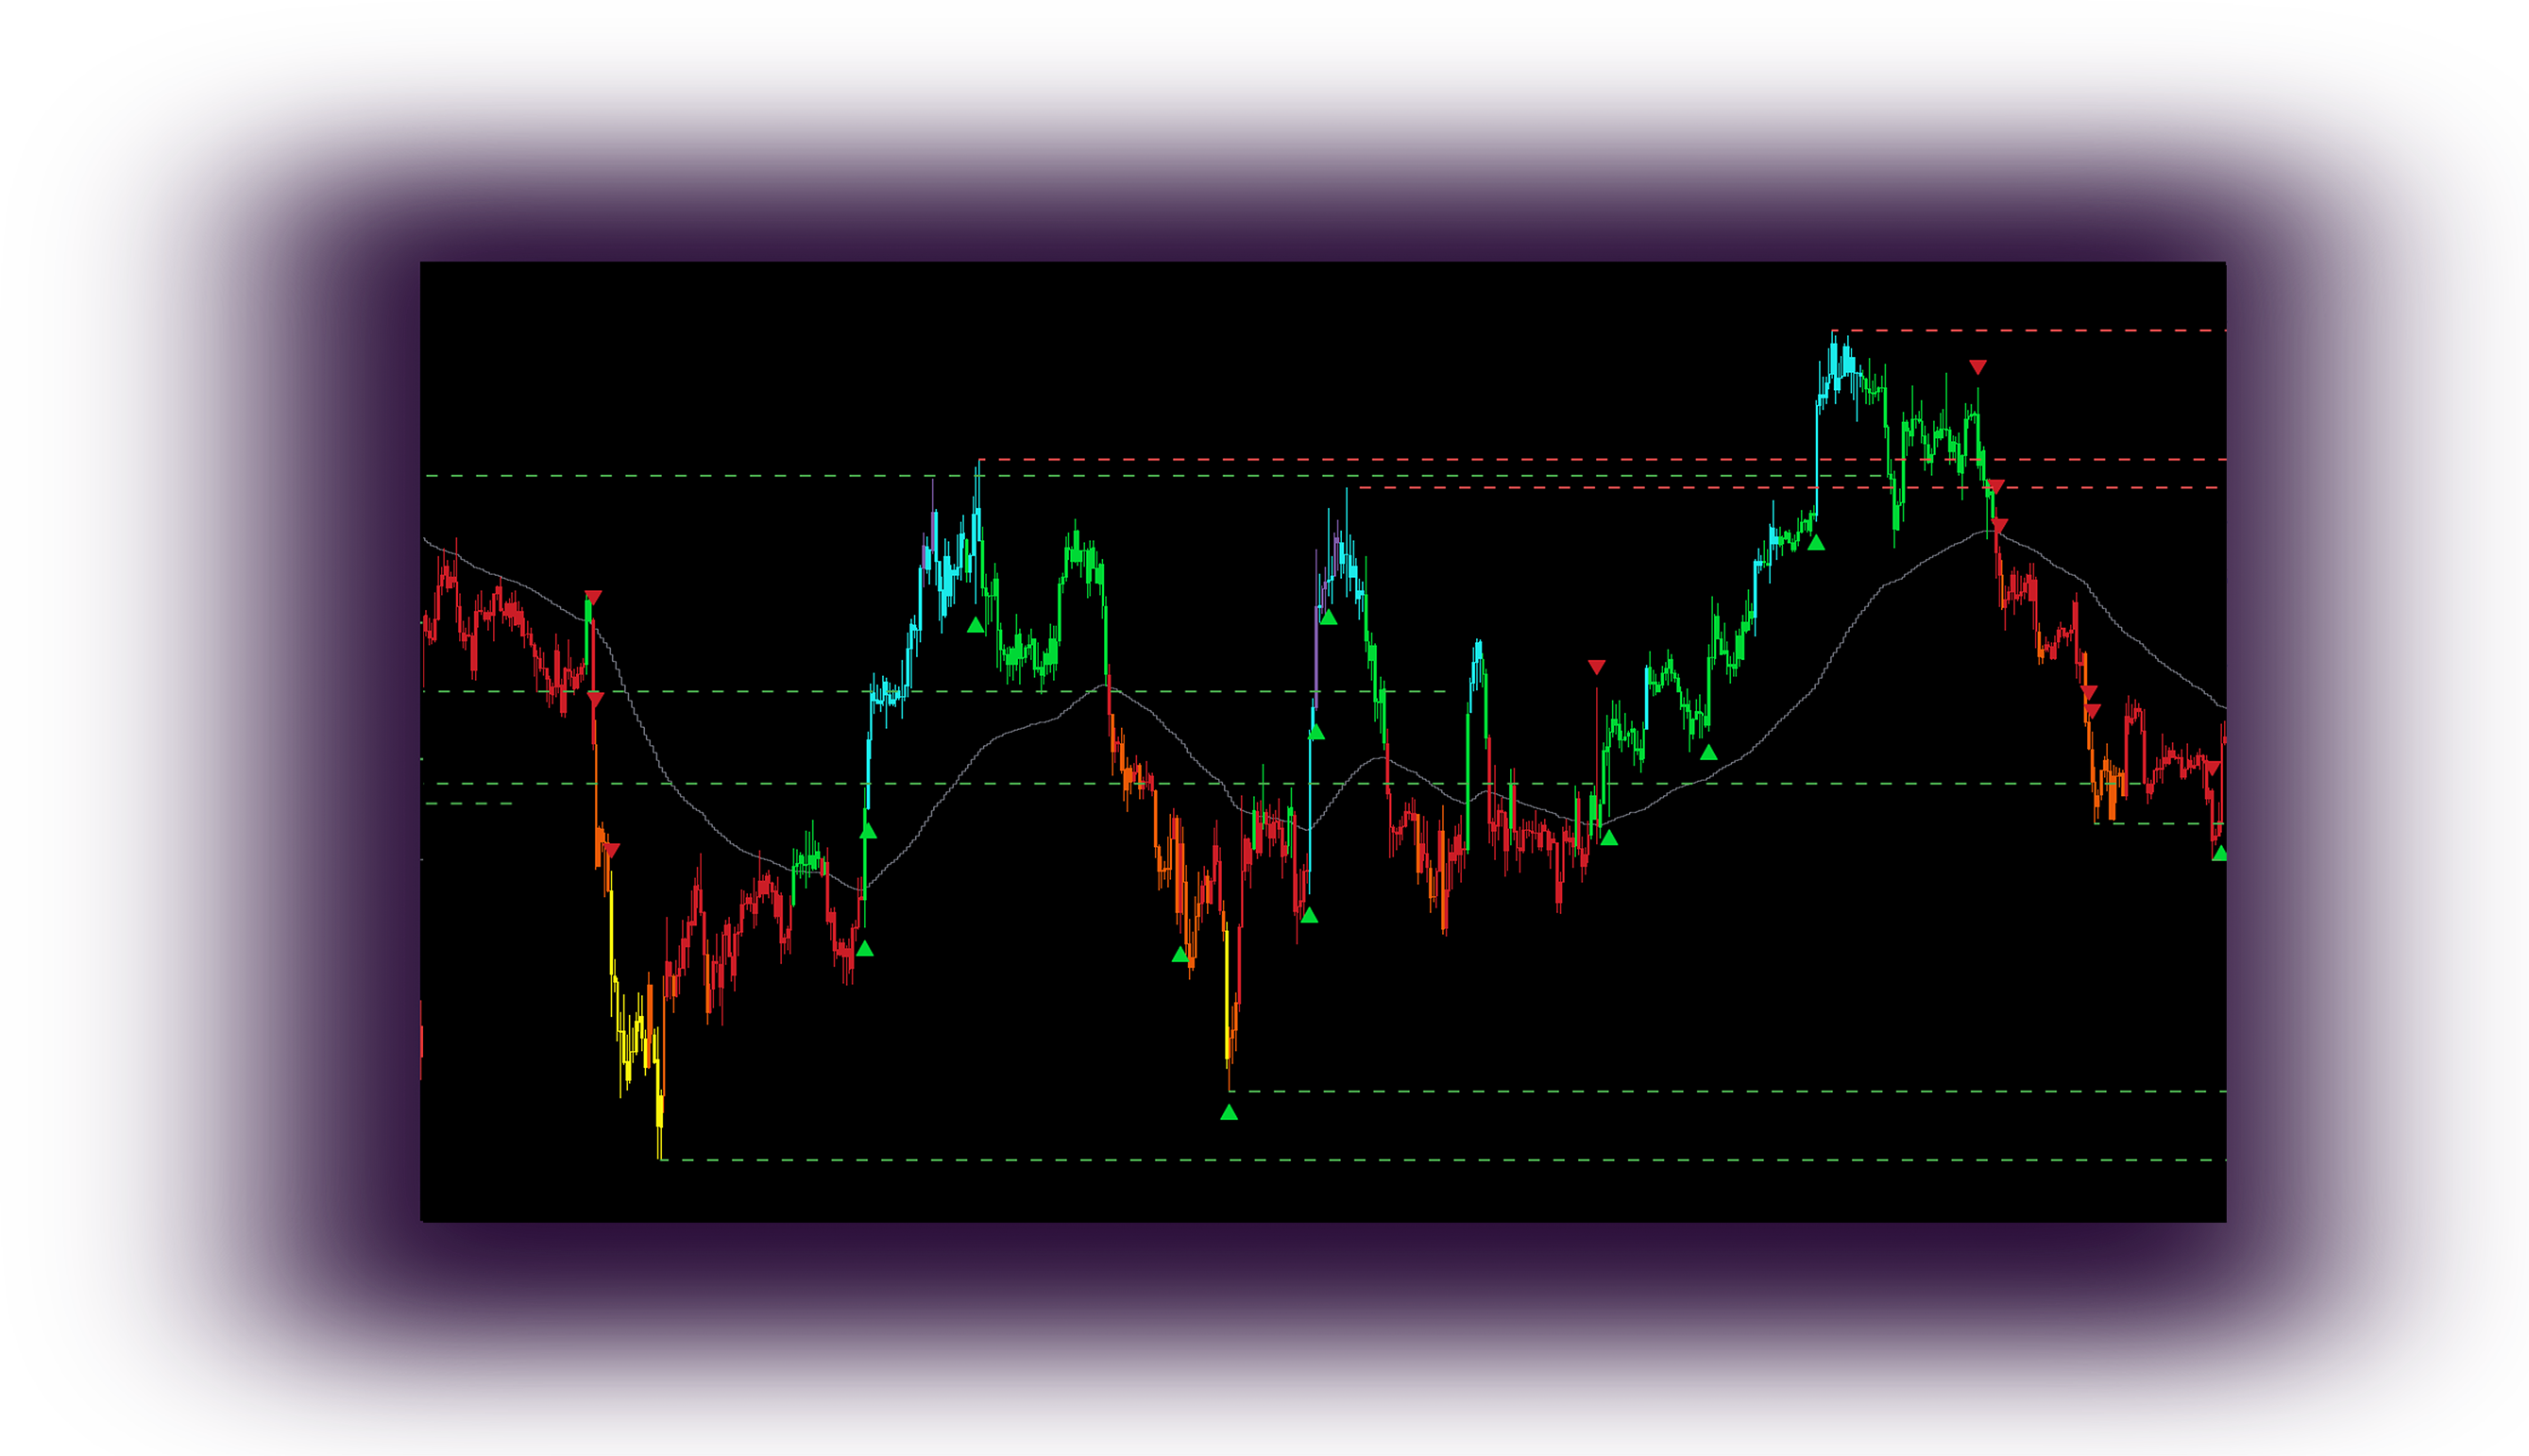
Primary Indicator for Rainbow Theory that uses multi-colored candles to paint price-action and detect whale movement while highlighting key pivot points.
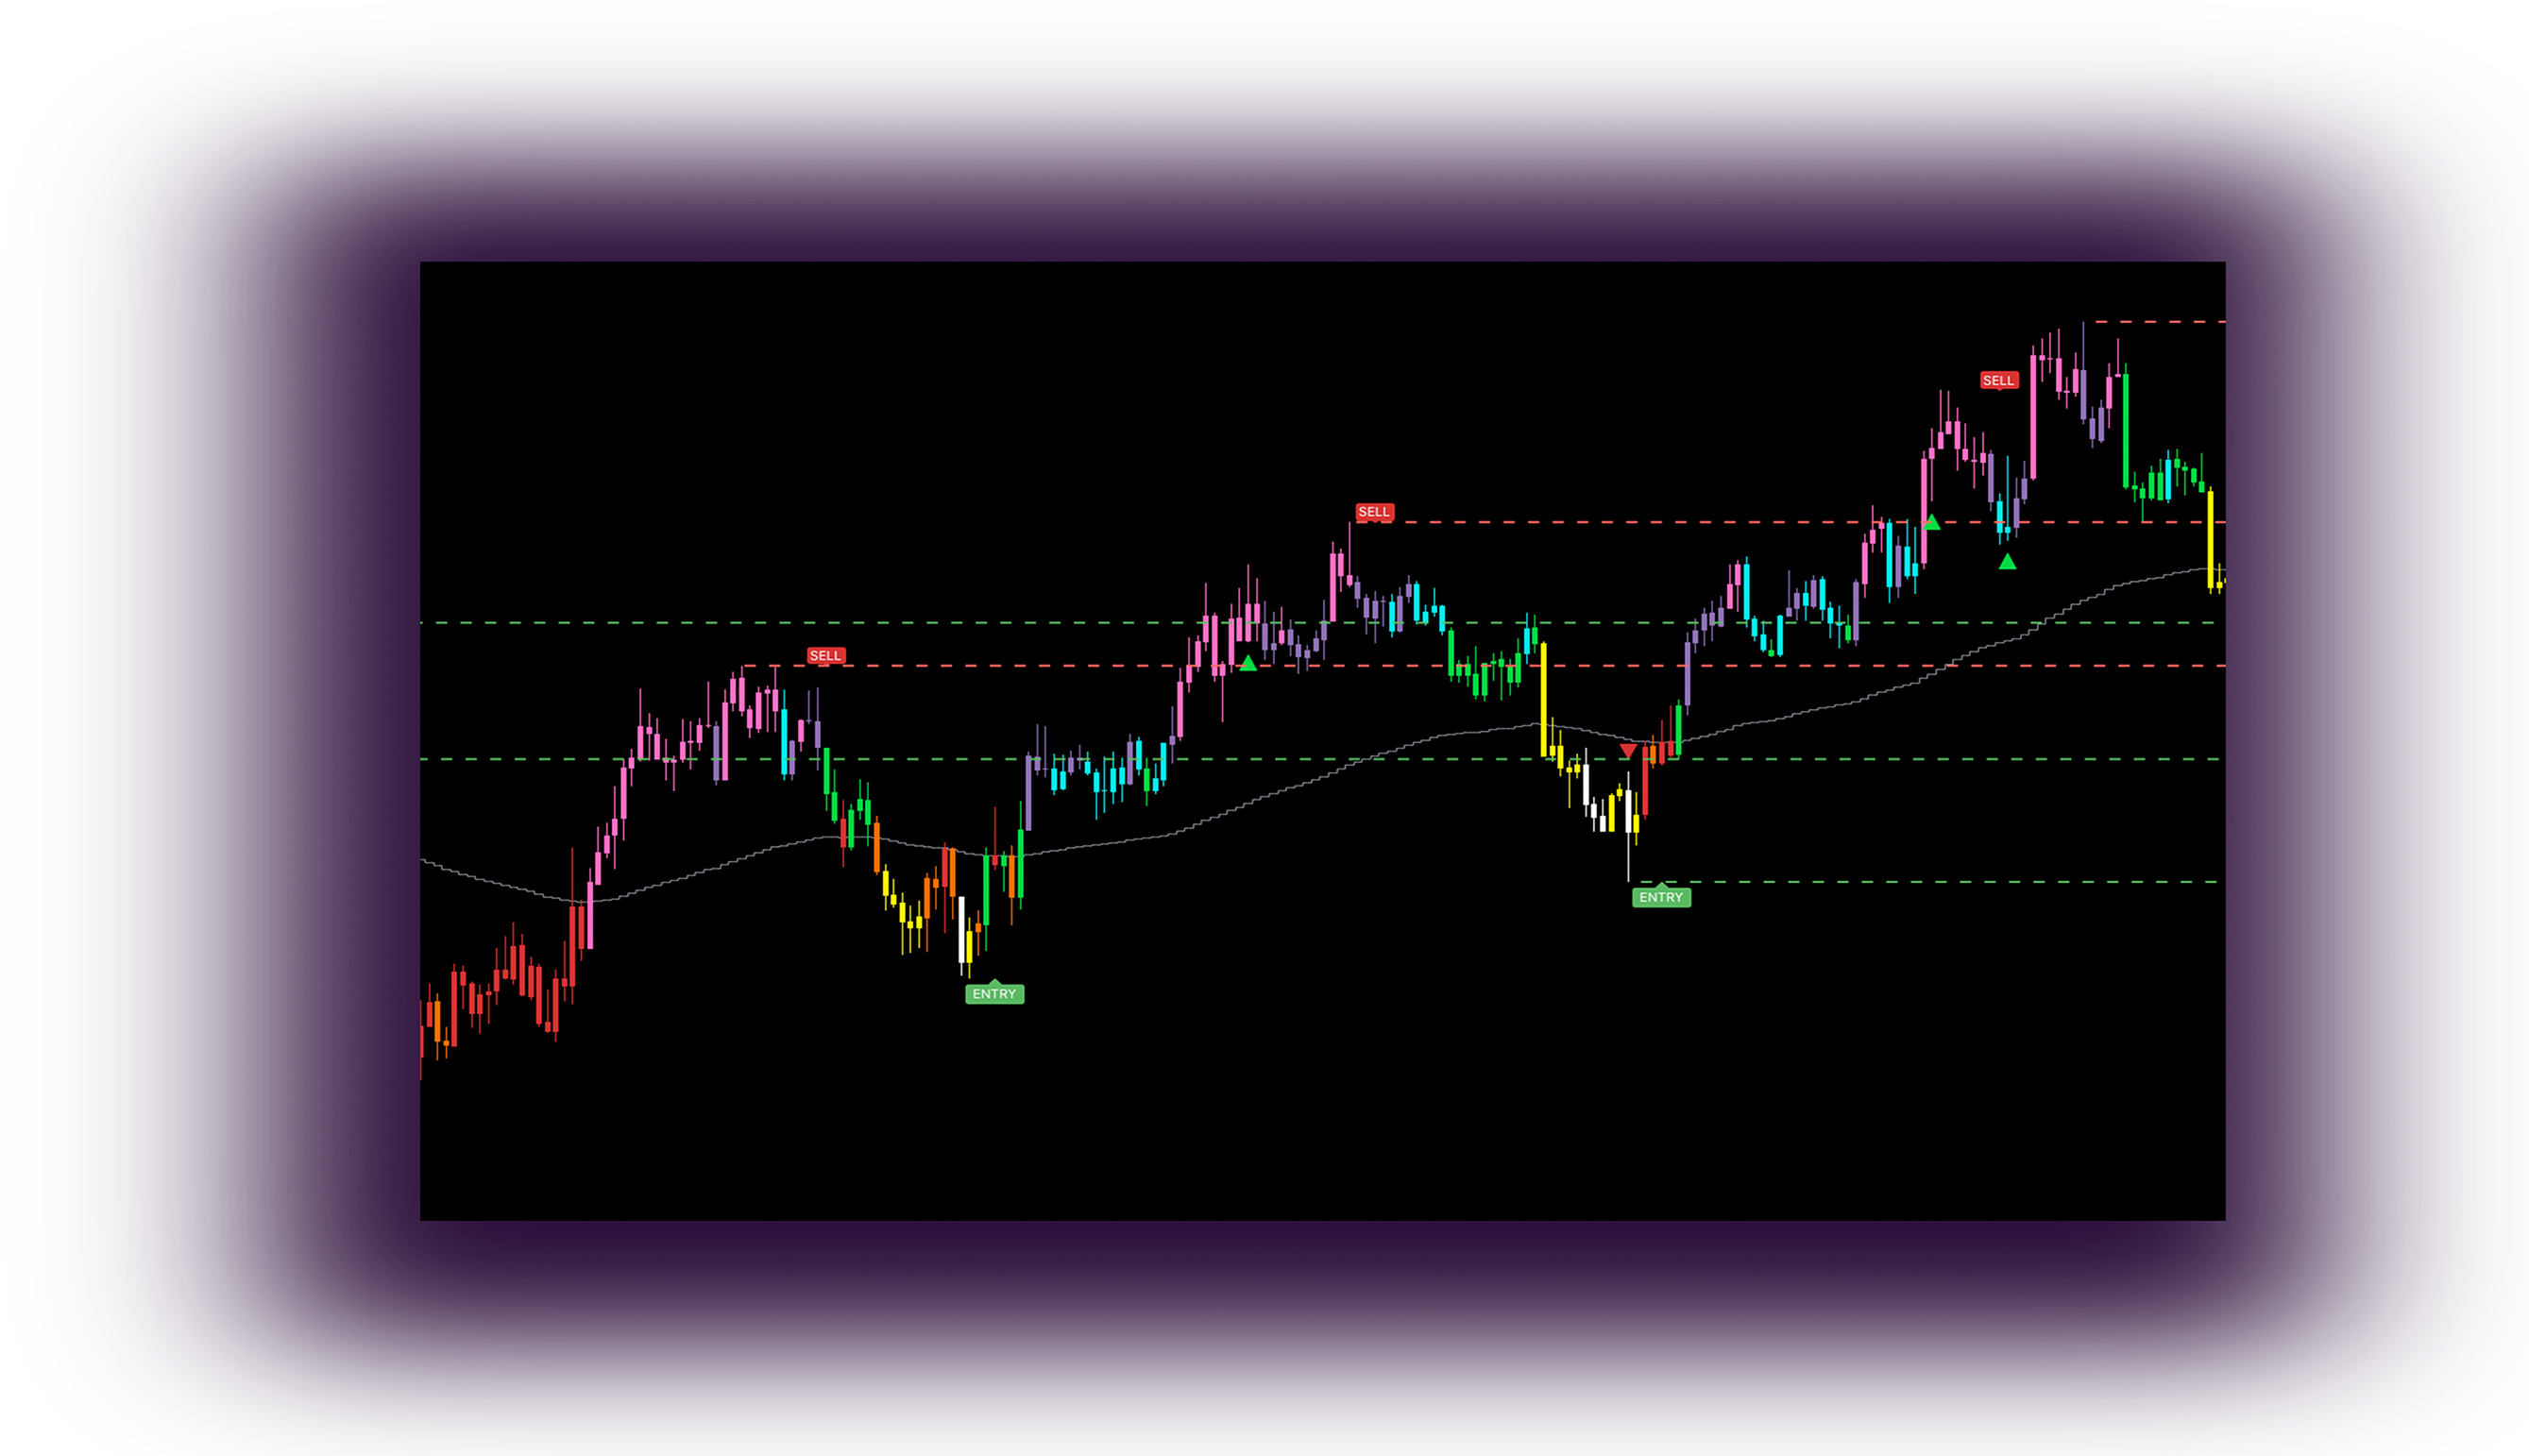
Proprietary algorithm that took 4 years to develop. Identifies tops and bottoms automatically for any asset with no tuning required.
