Crypto & Stock
Trading Indicators
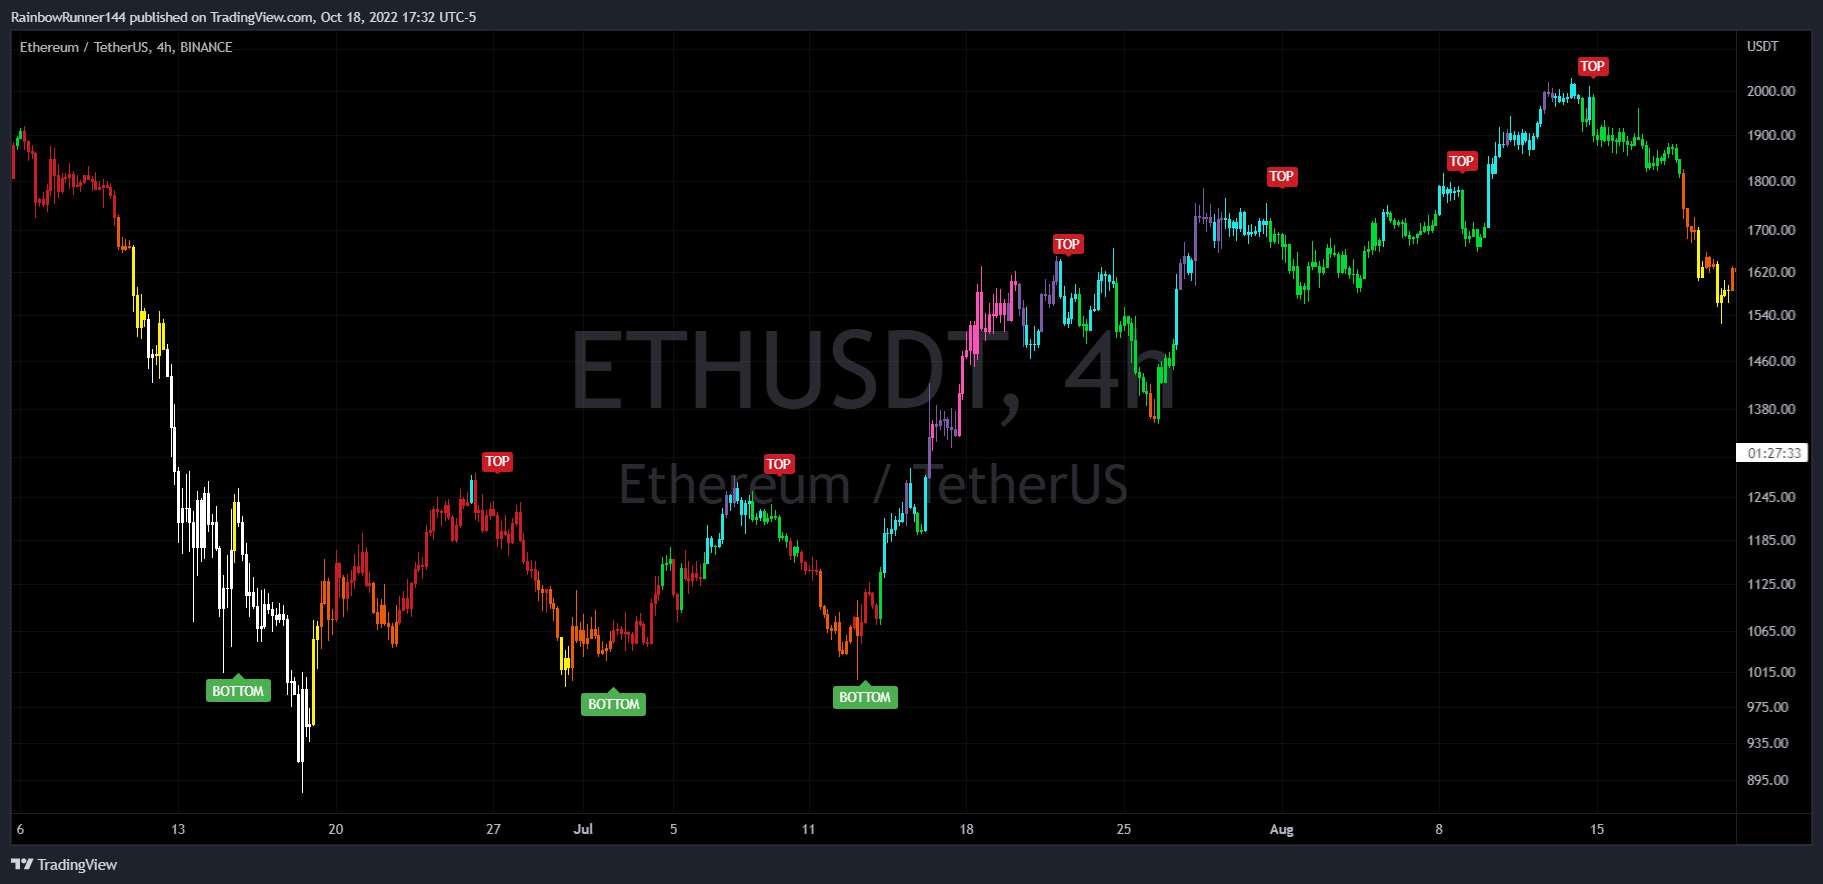
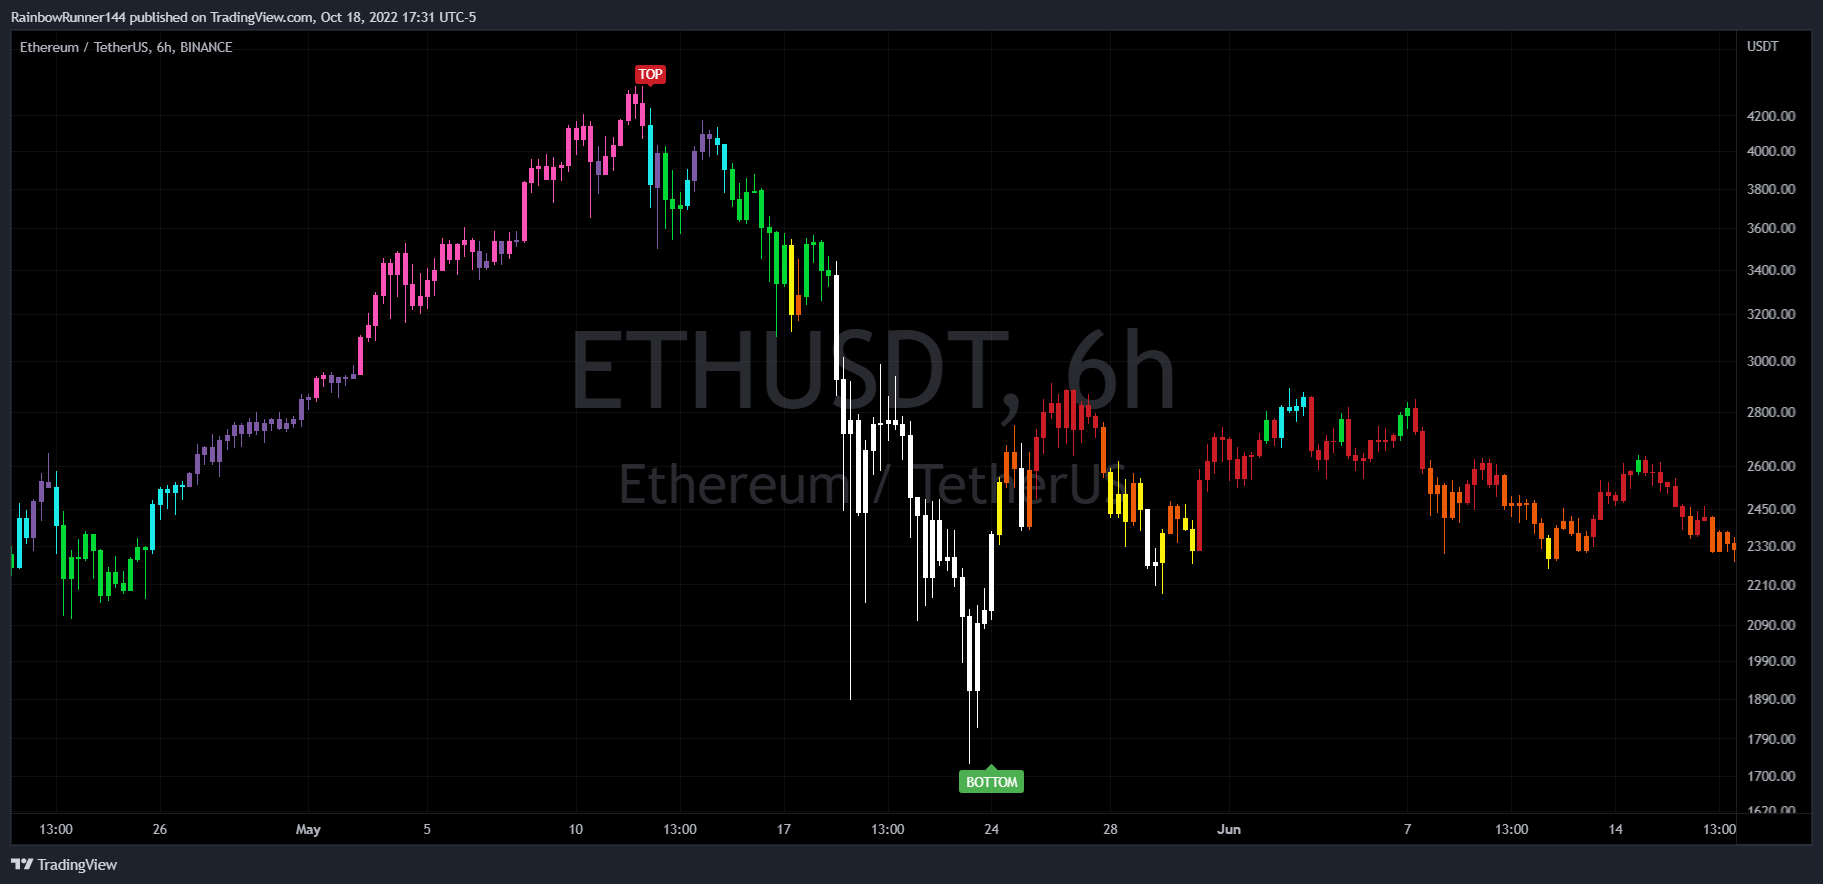
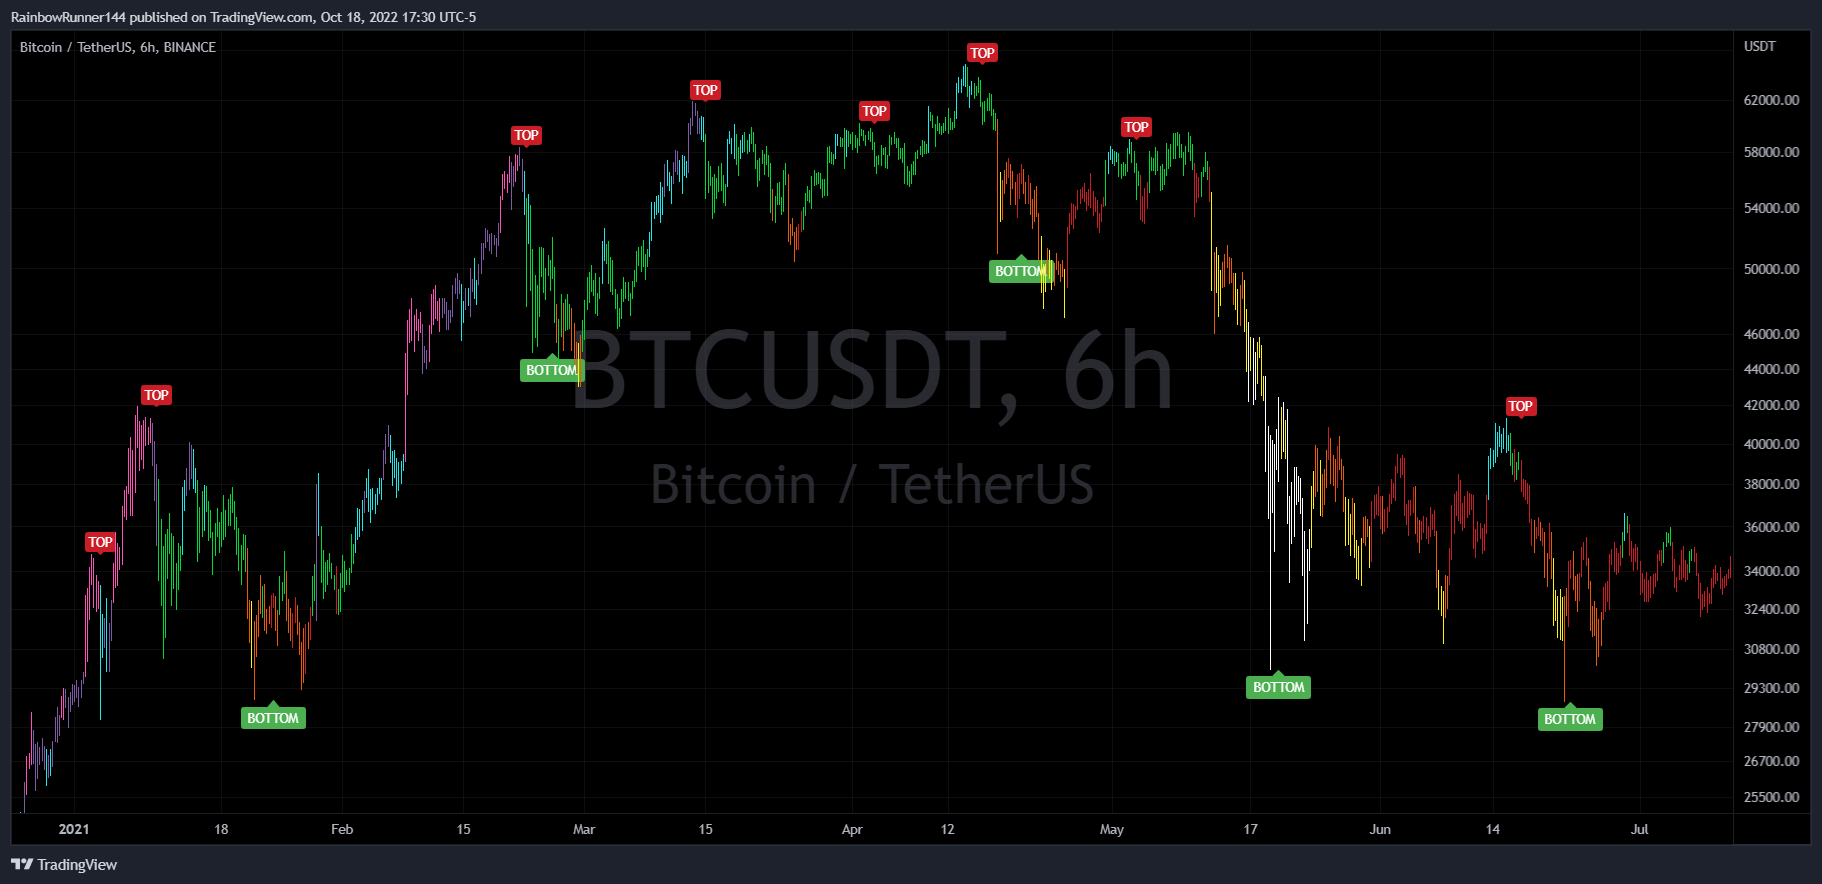
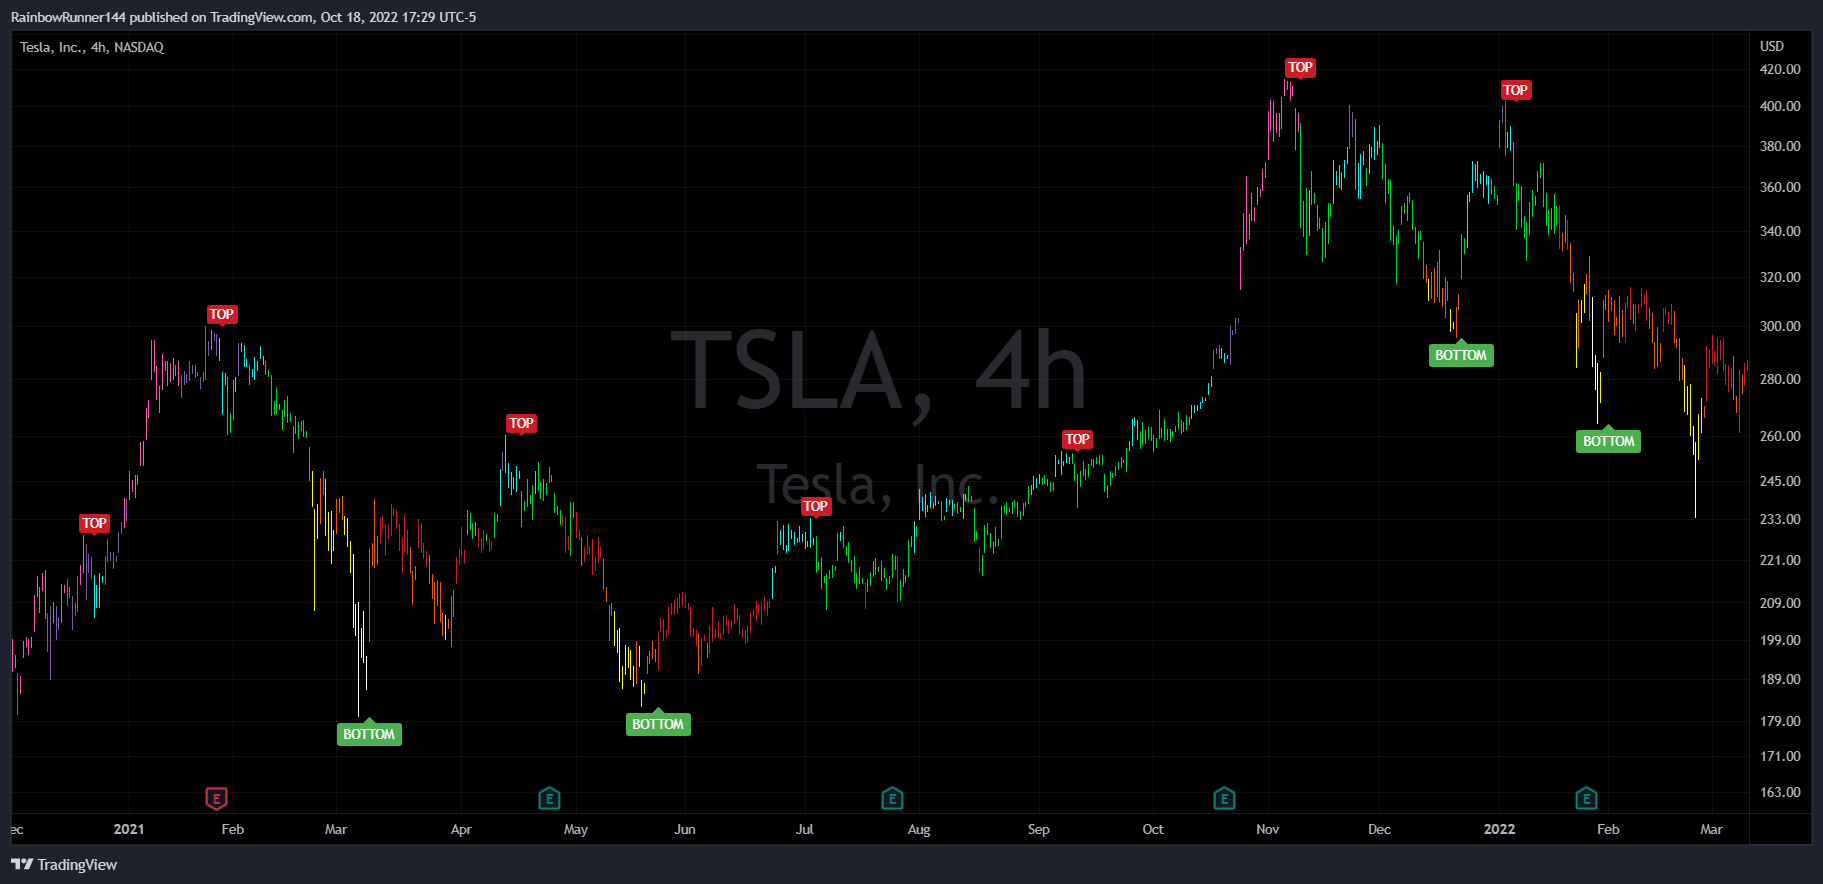
Complex markets require more than two colors to paint the real story of the price action.
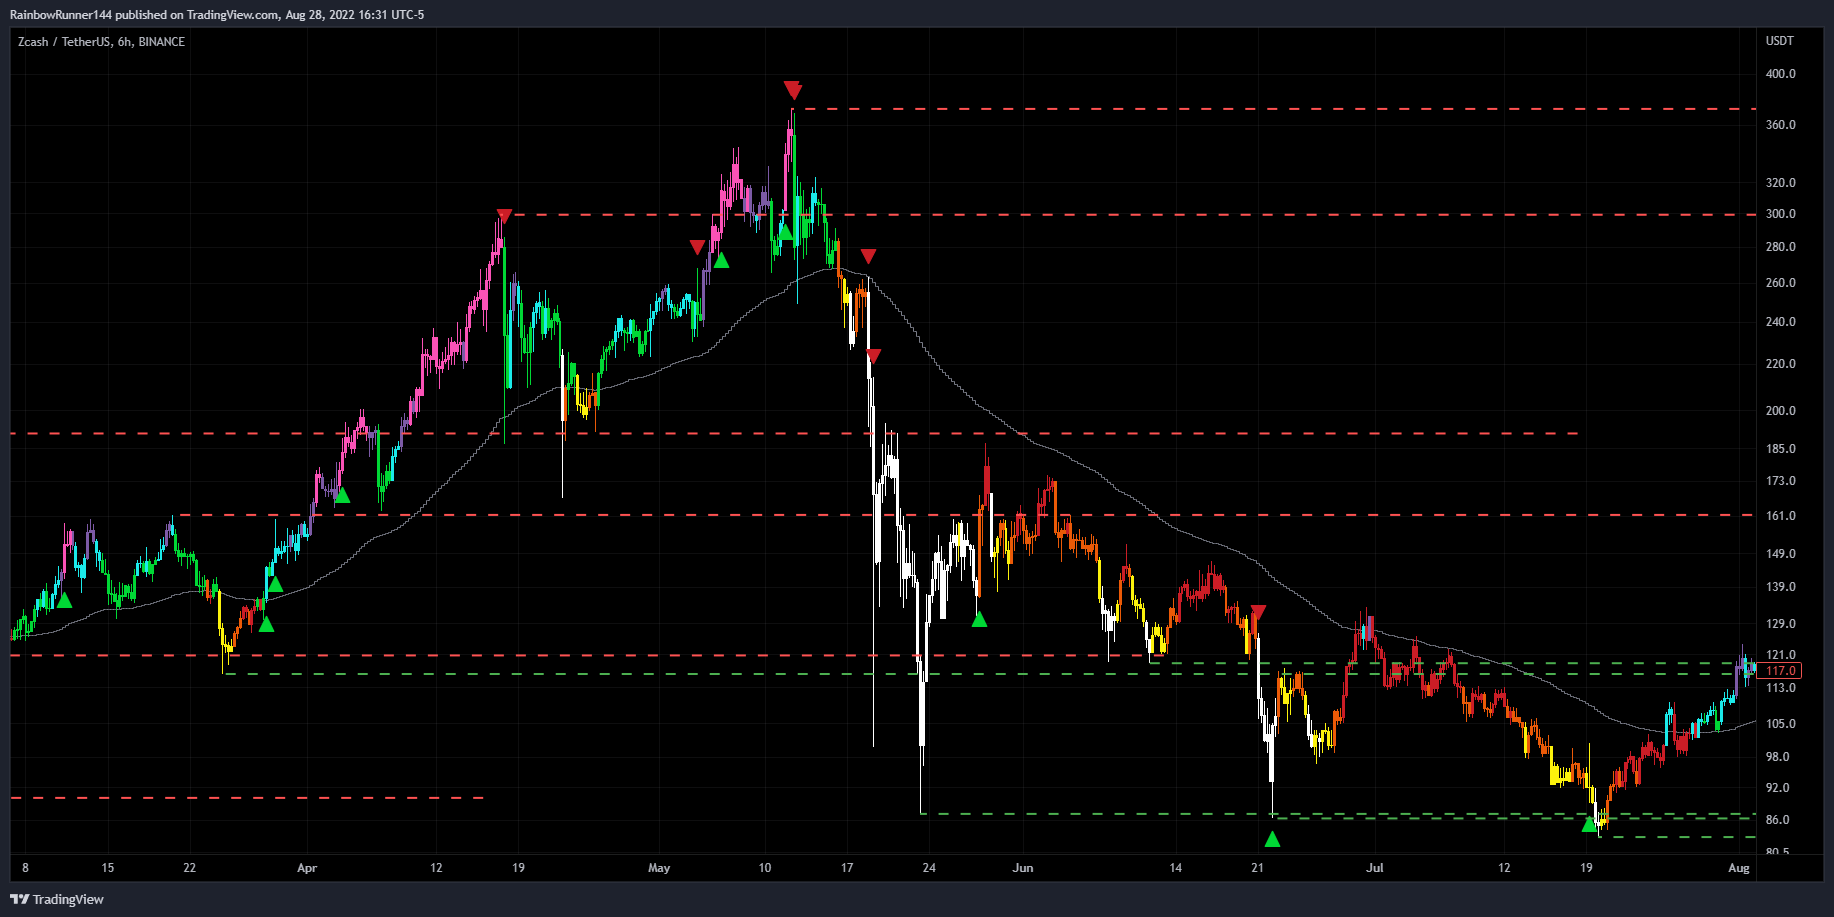
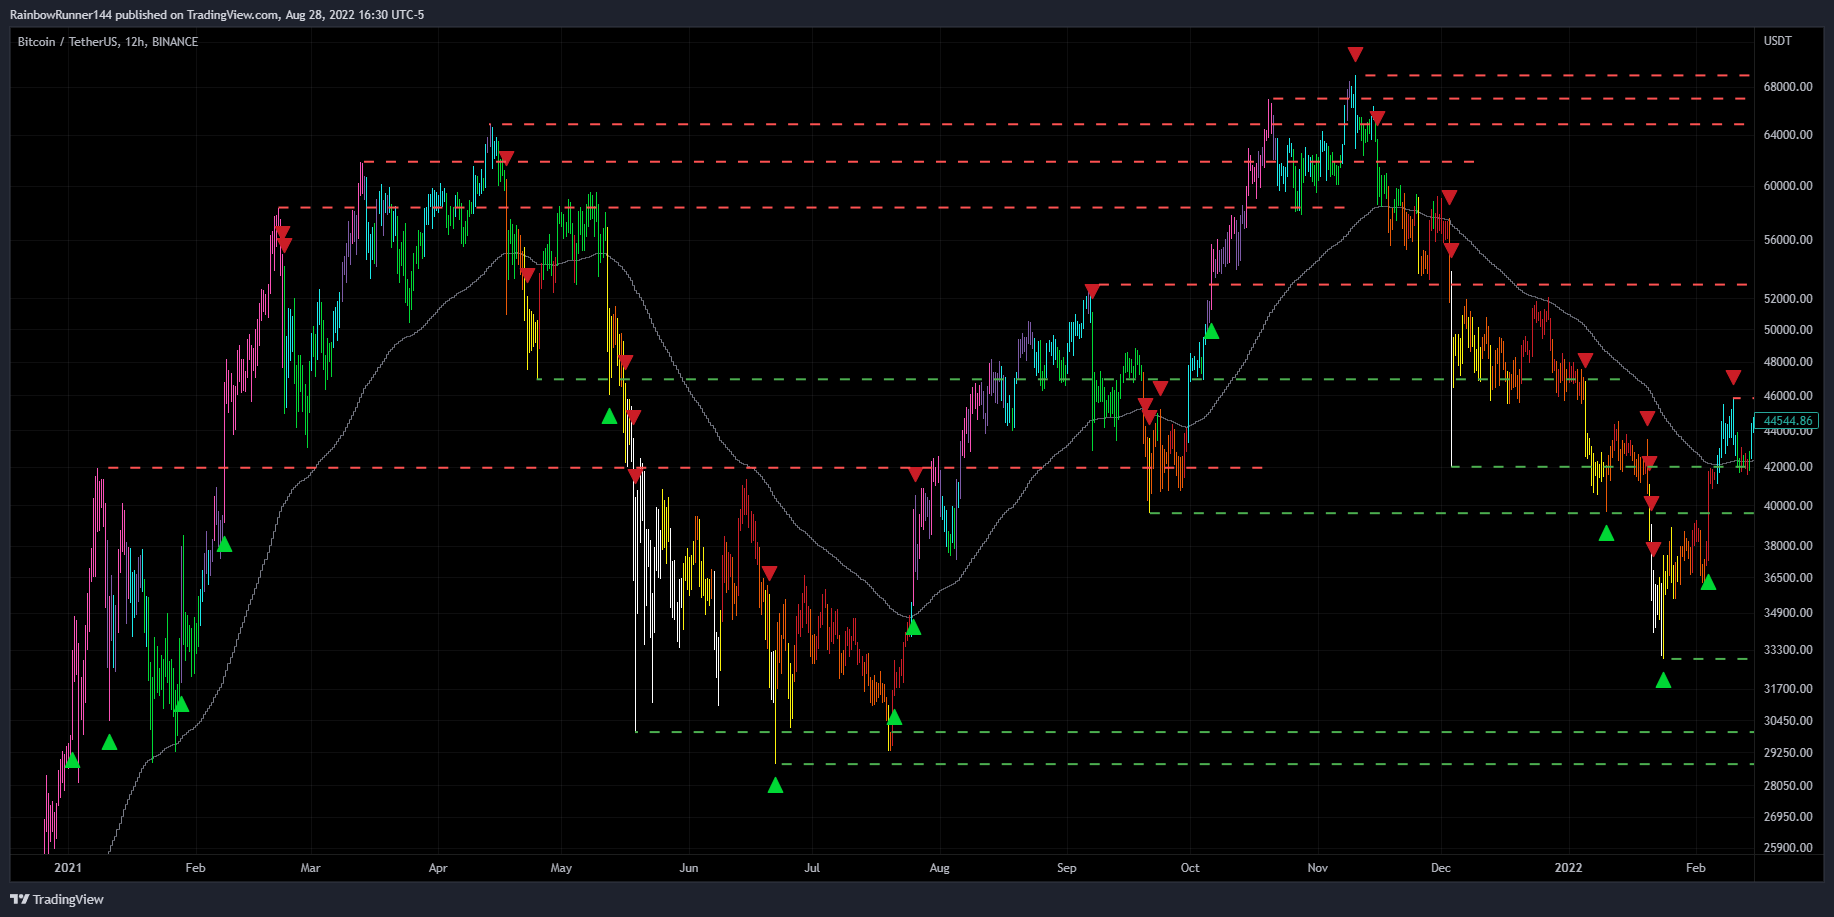
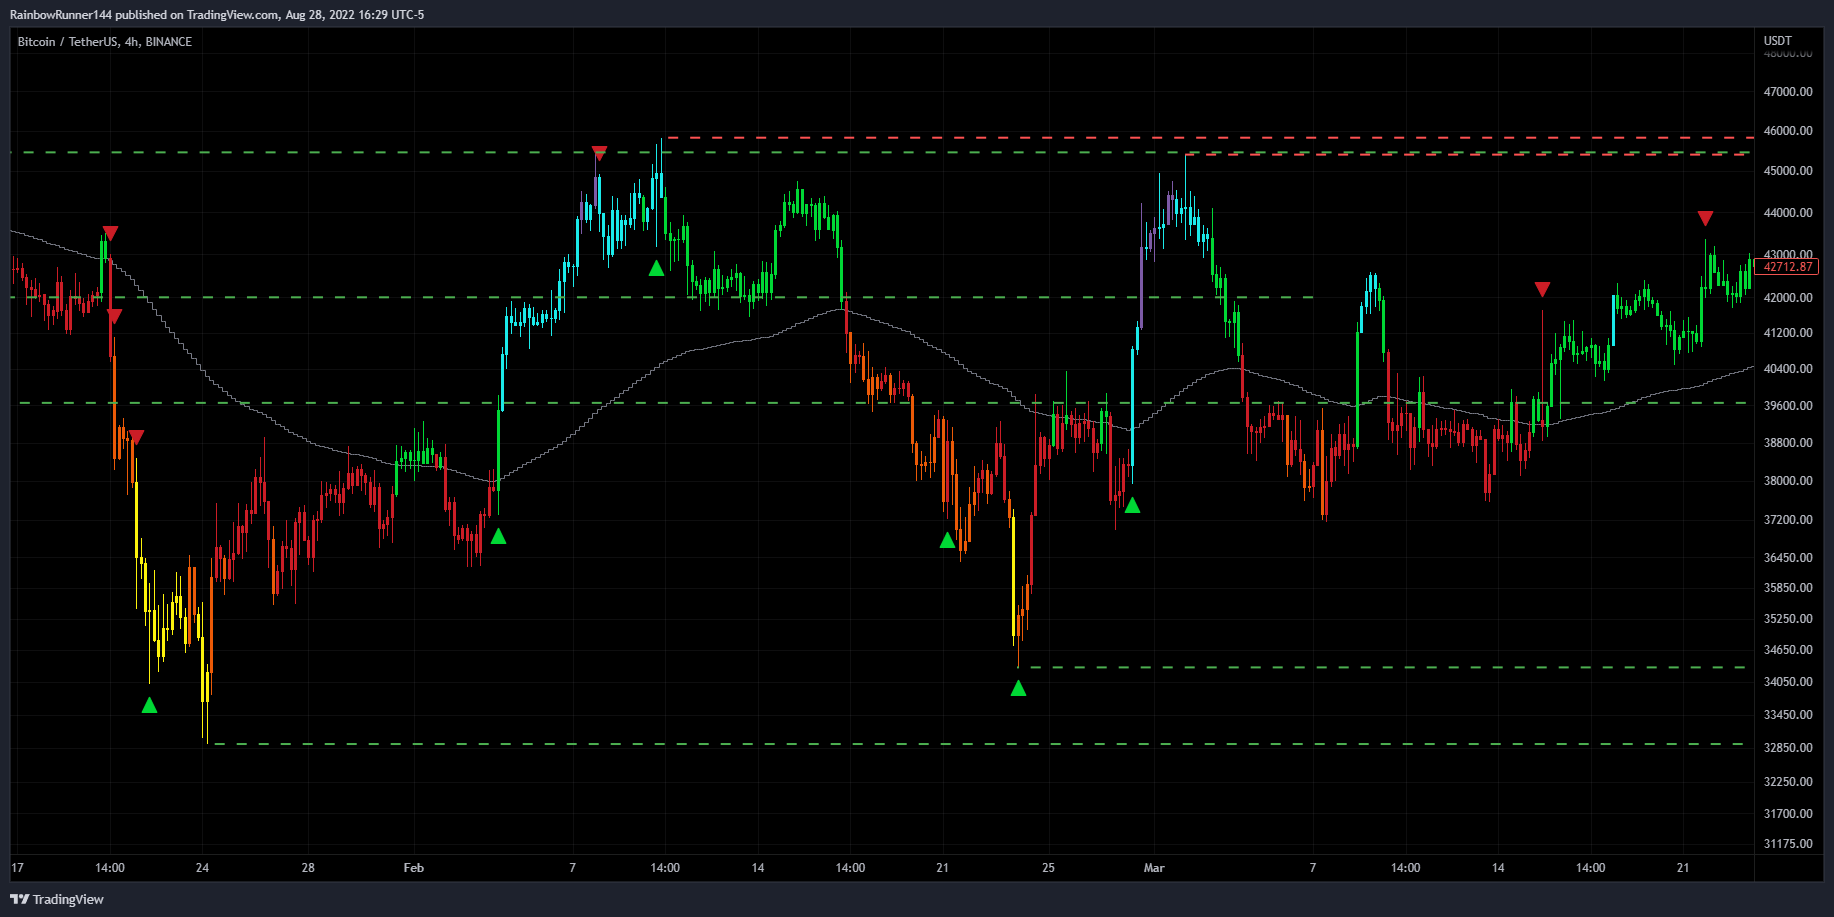
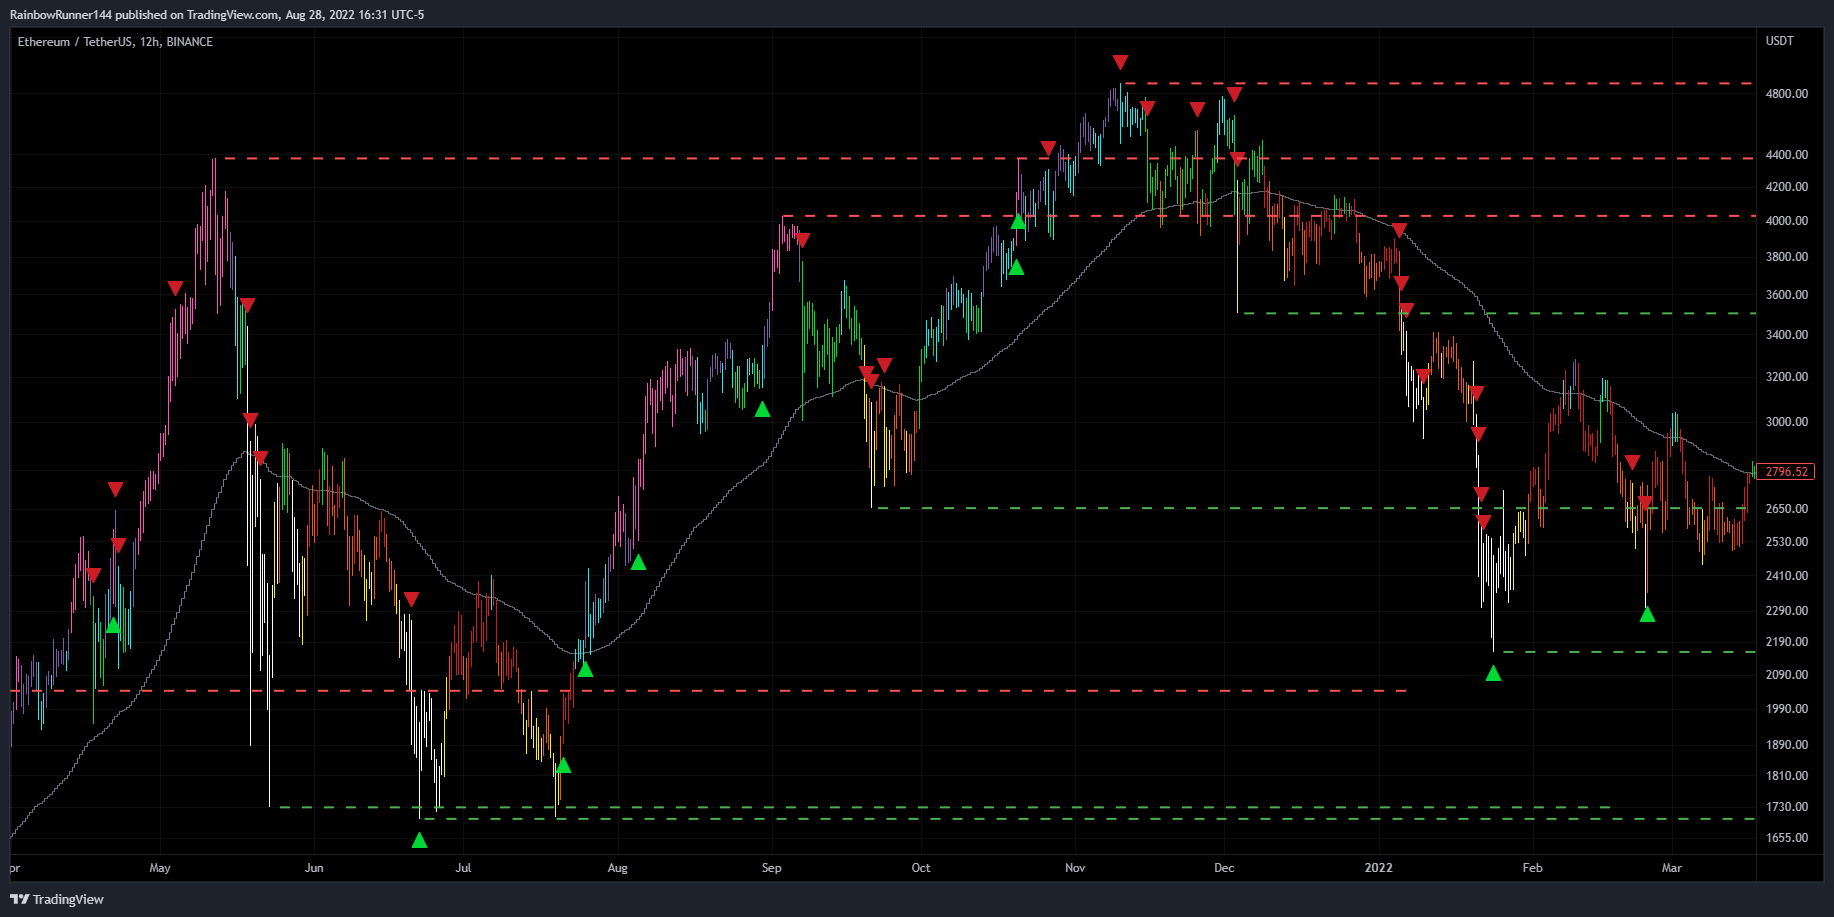
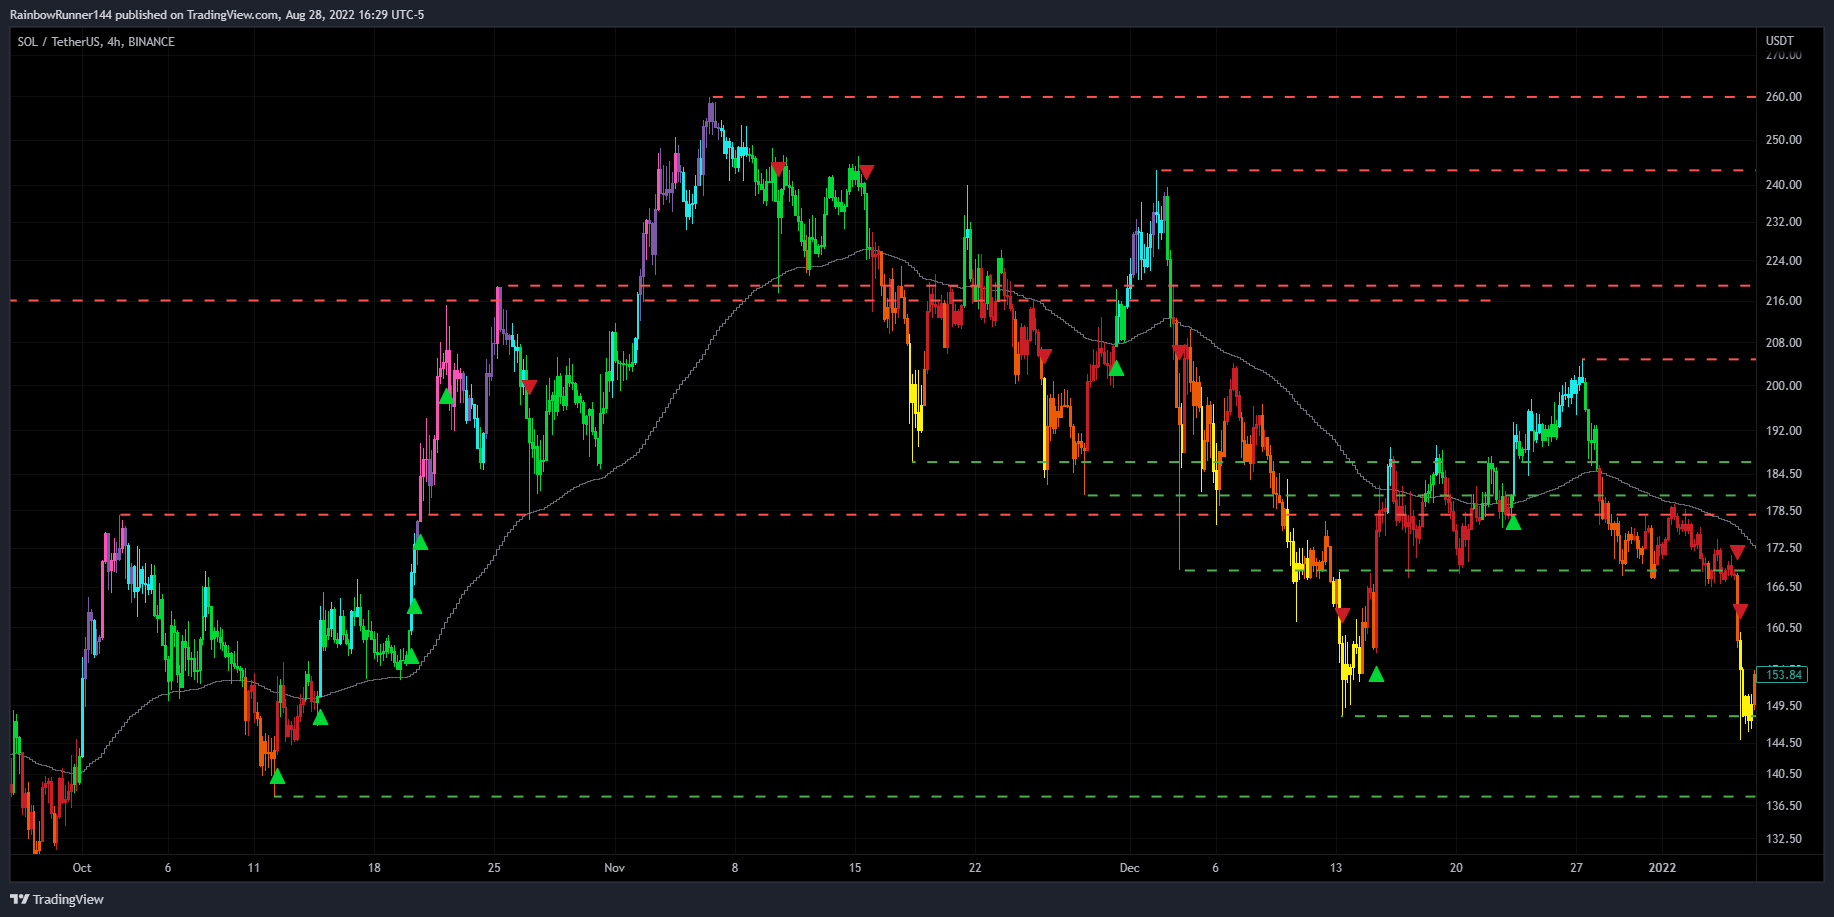
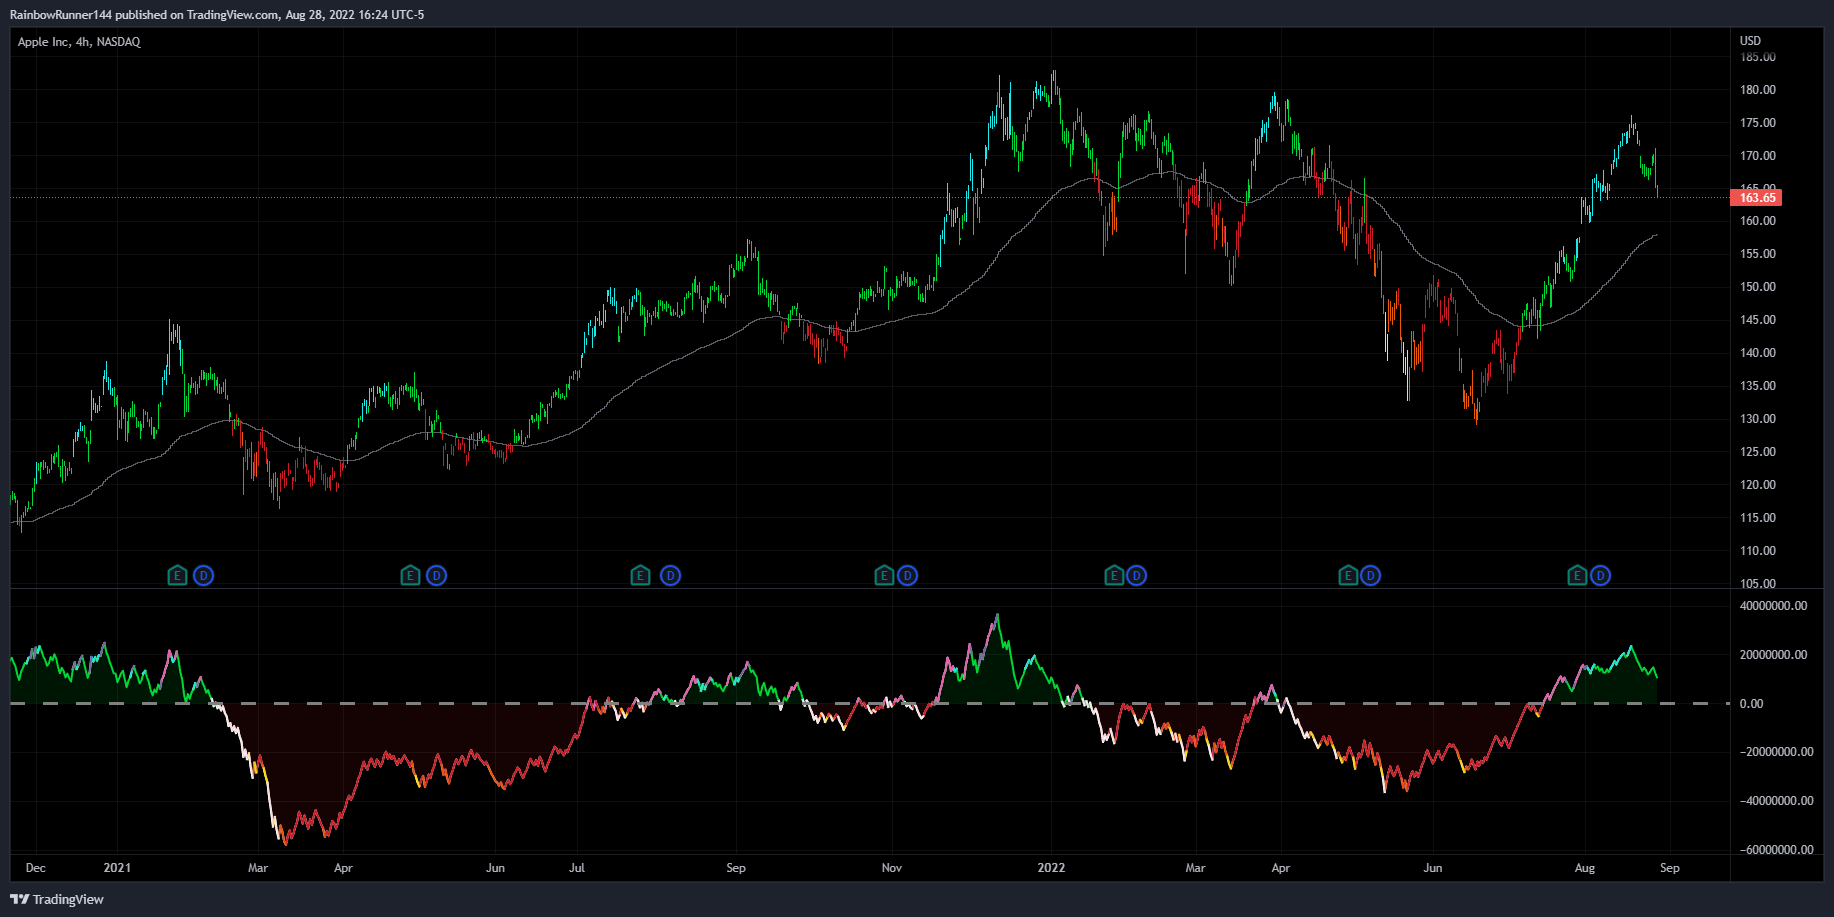
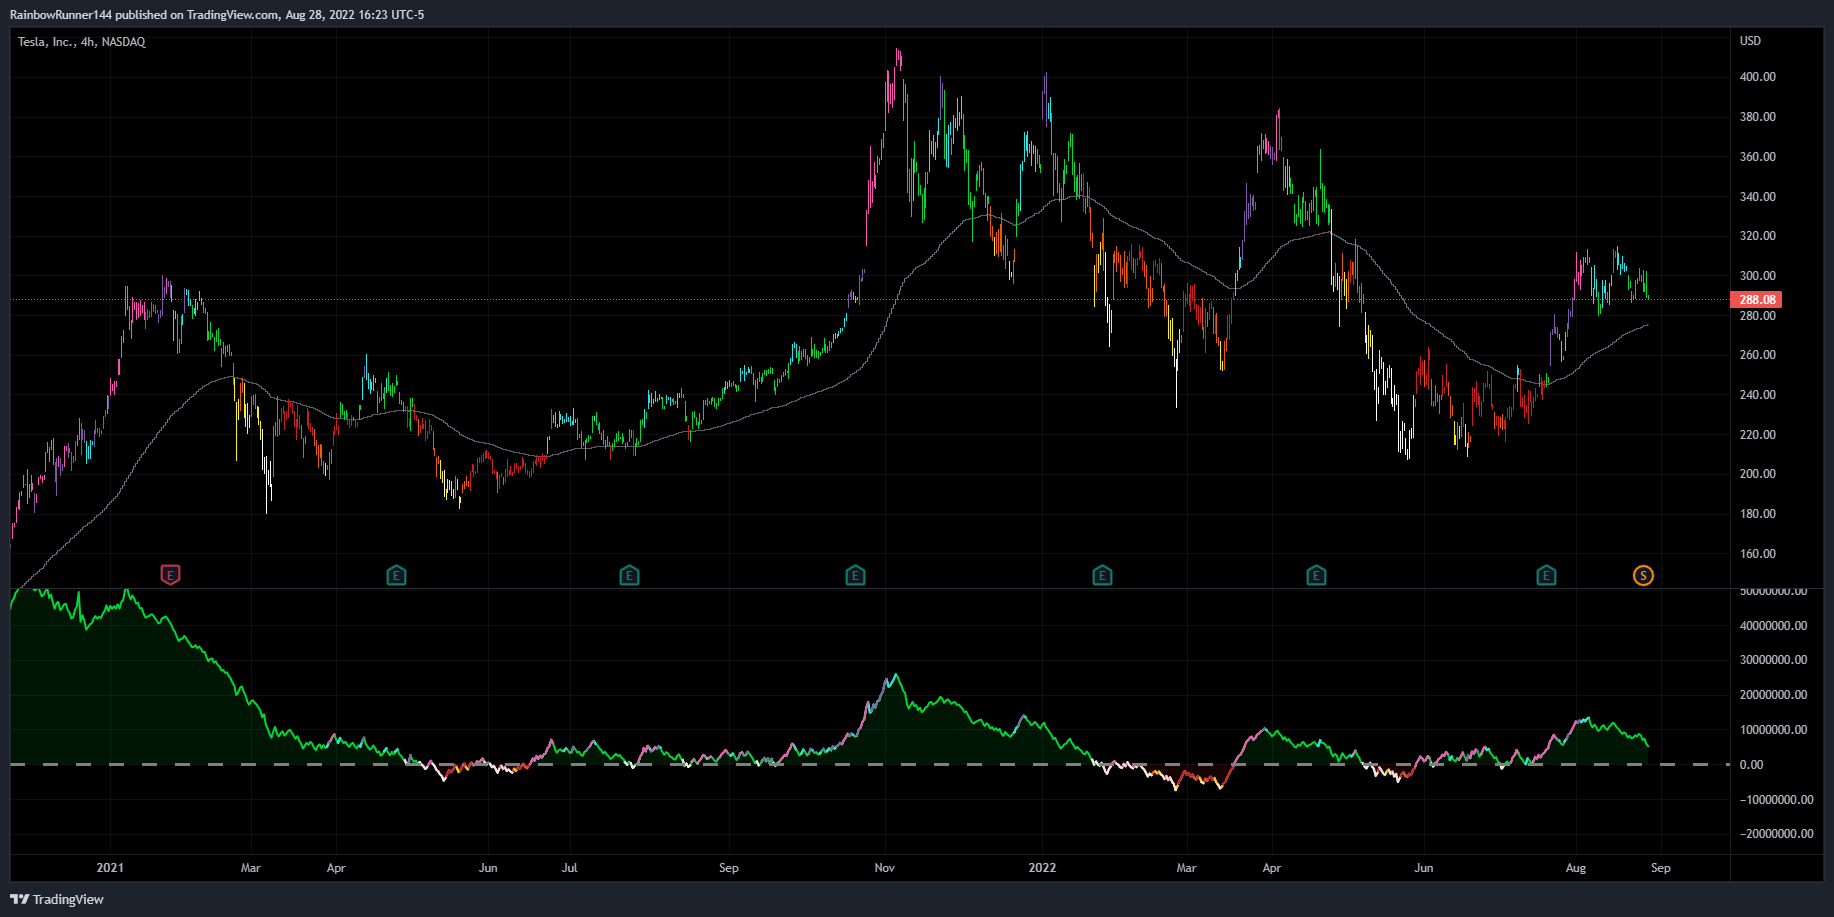
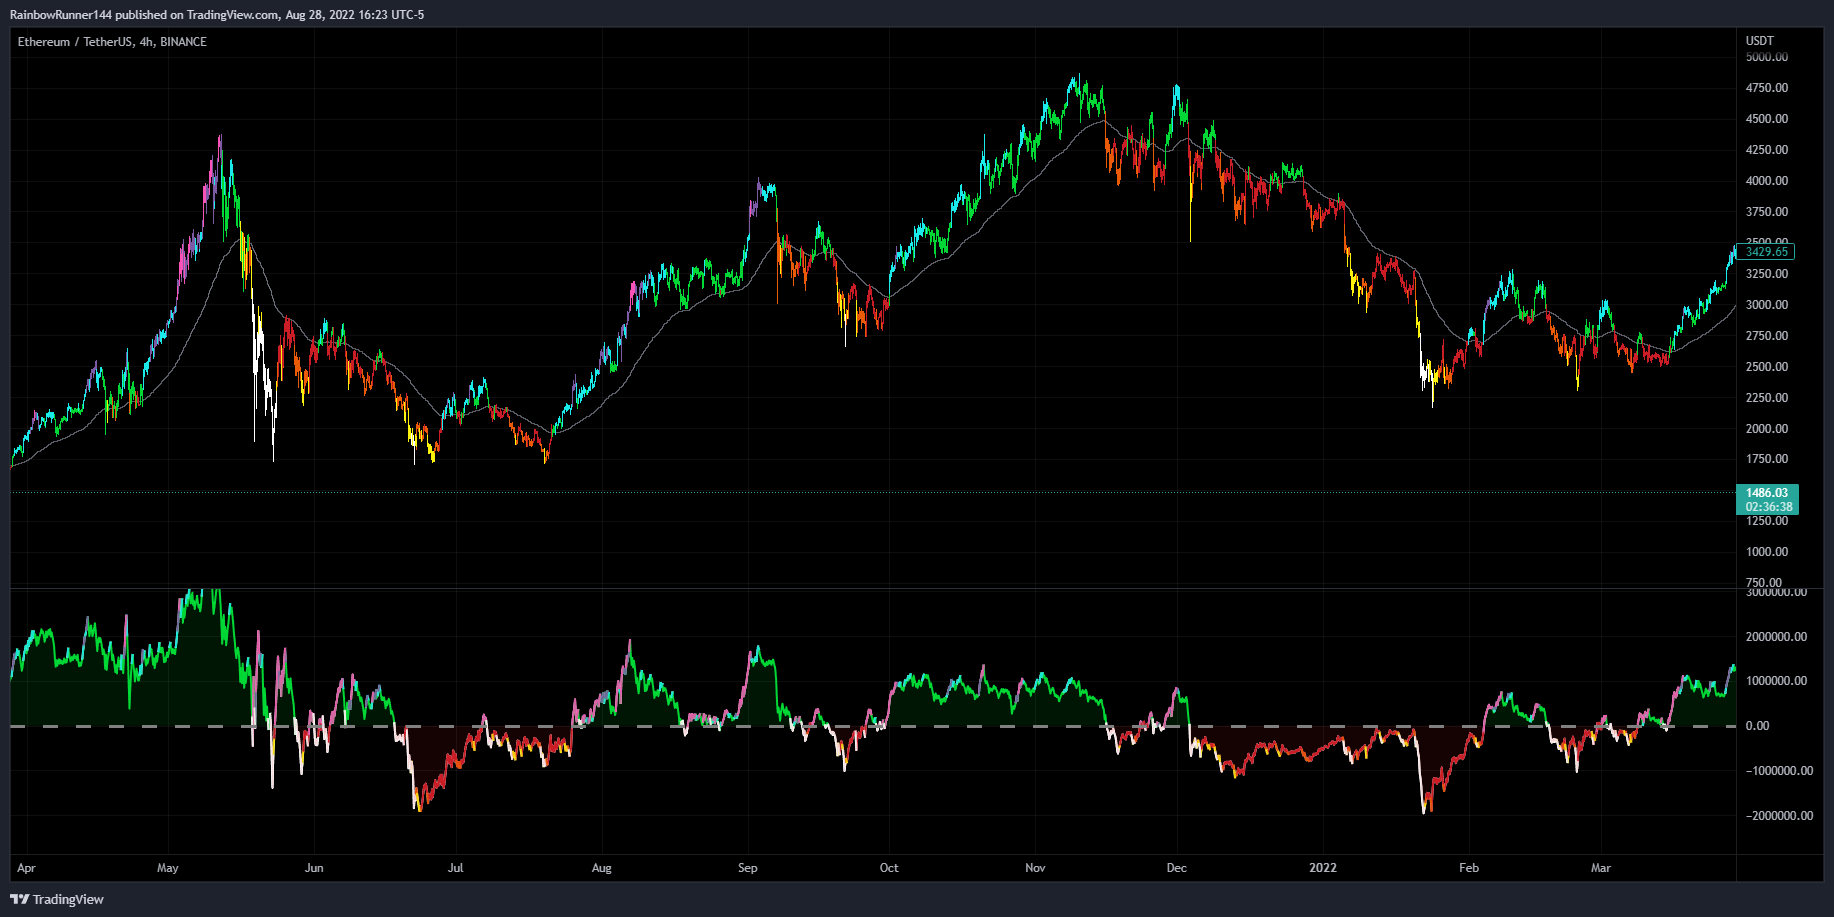
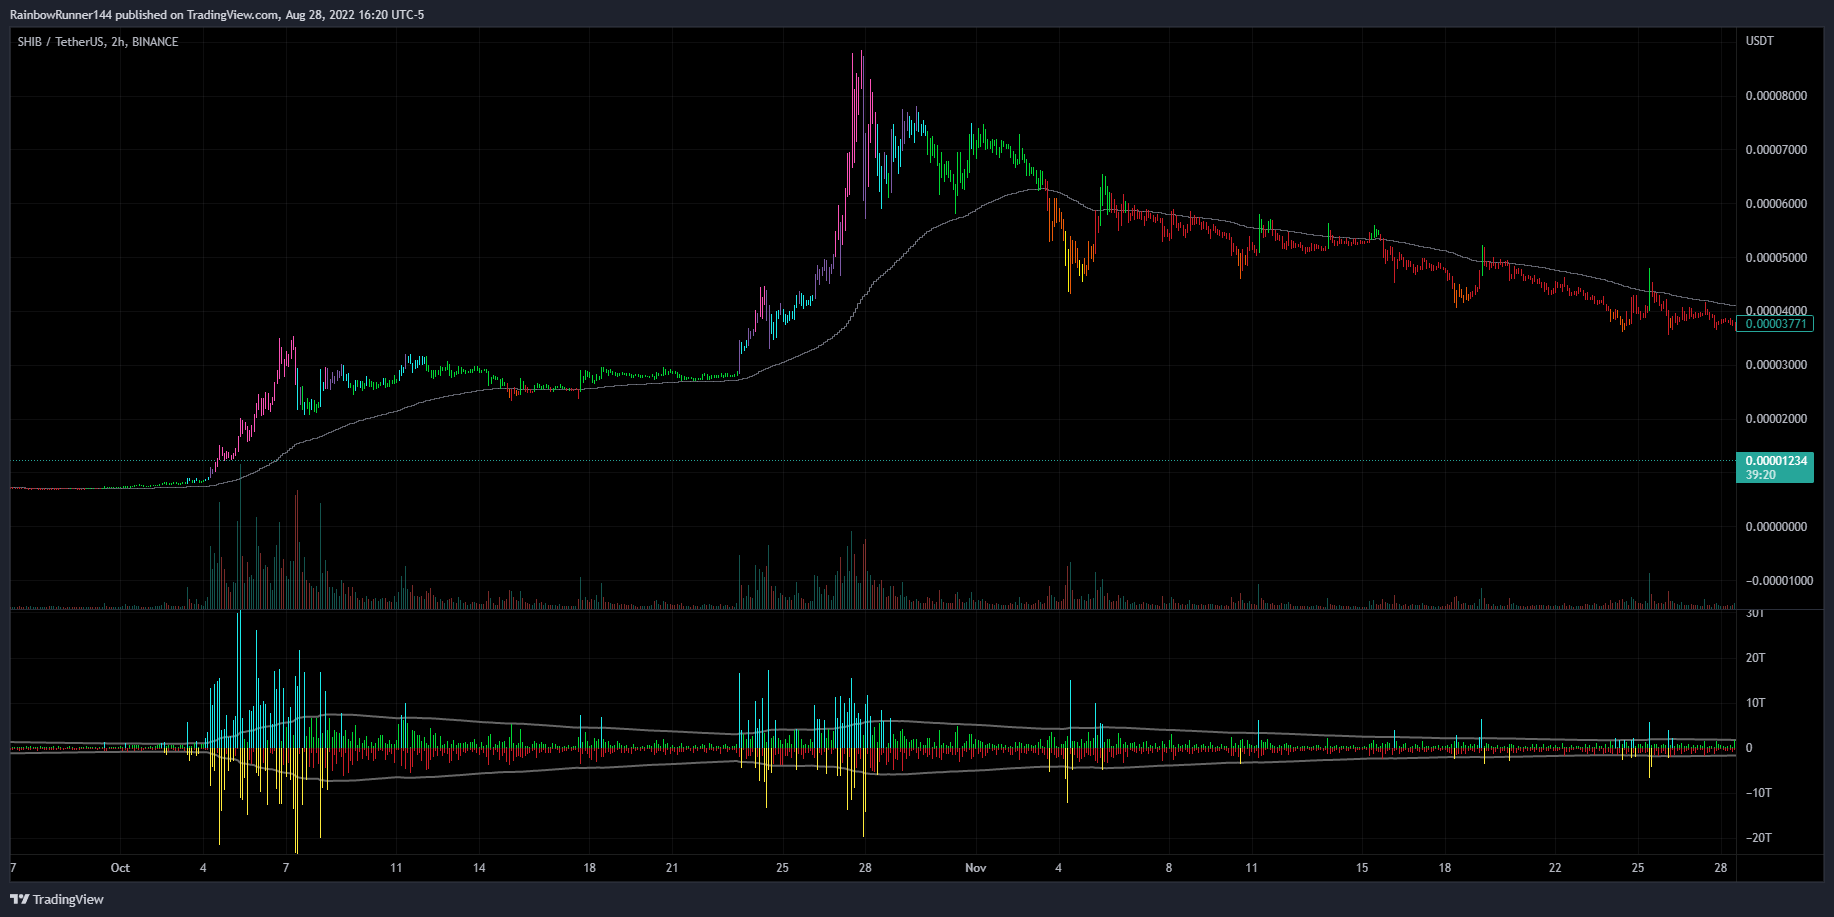
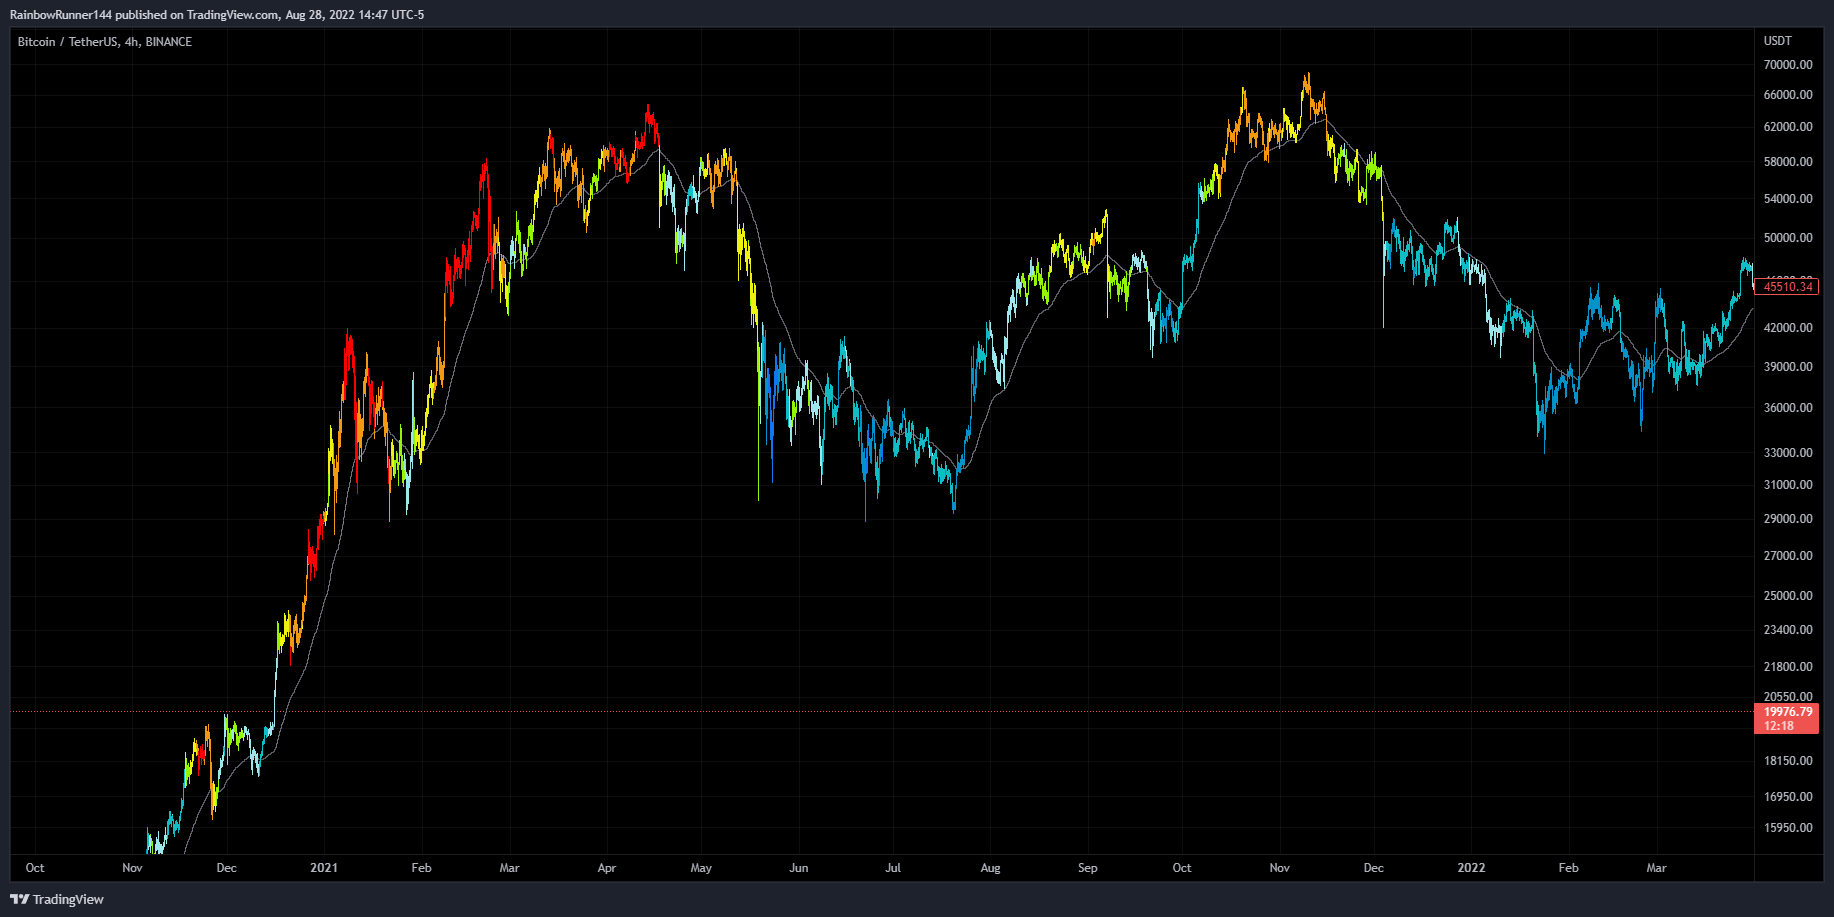
Born from experience, Rainbow Theory was developed to enable traders to see inside price action, versus merely looking at it. Rainbow Trends utilizes bots and colors to visualize price action in real-time. These tools enable traders to easily track the dynamic strengths and weaknesses of any market and reveal the actual nuanced story behind this deceptive tug of war between Bulls and Bears.
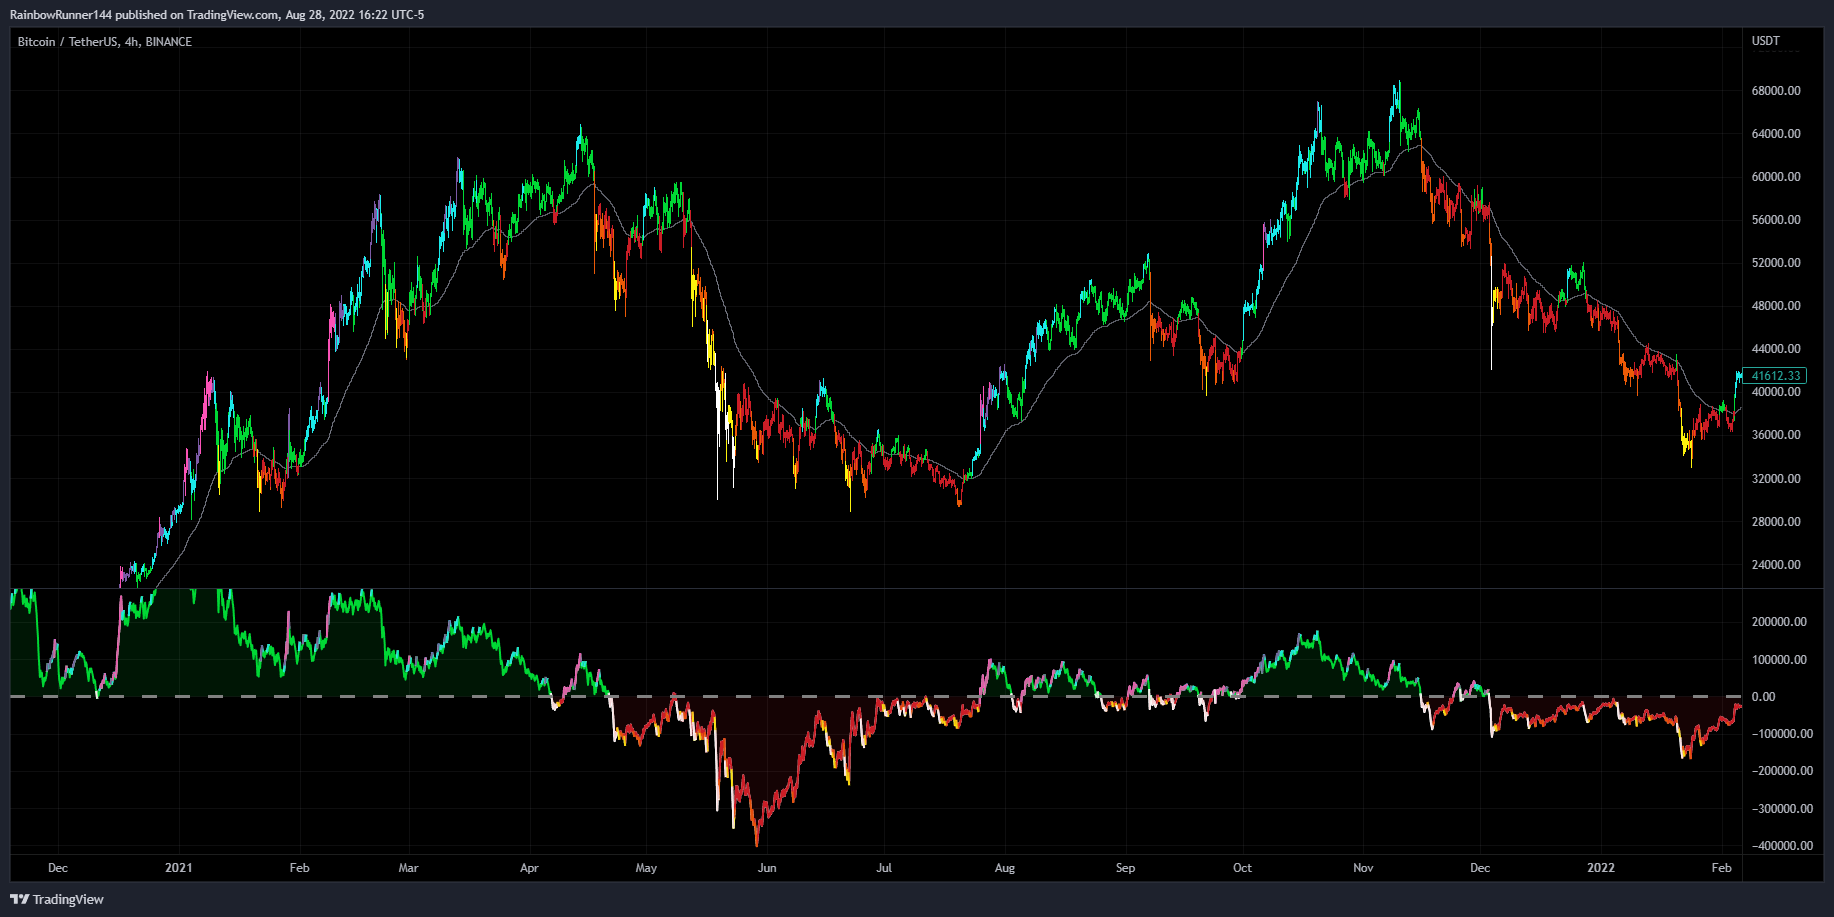
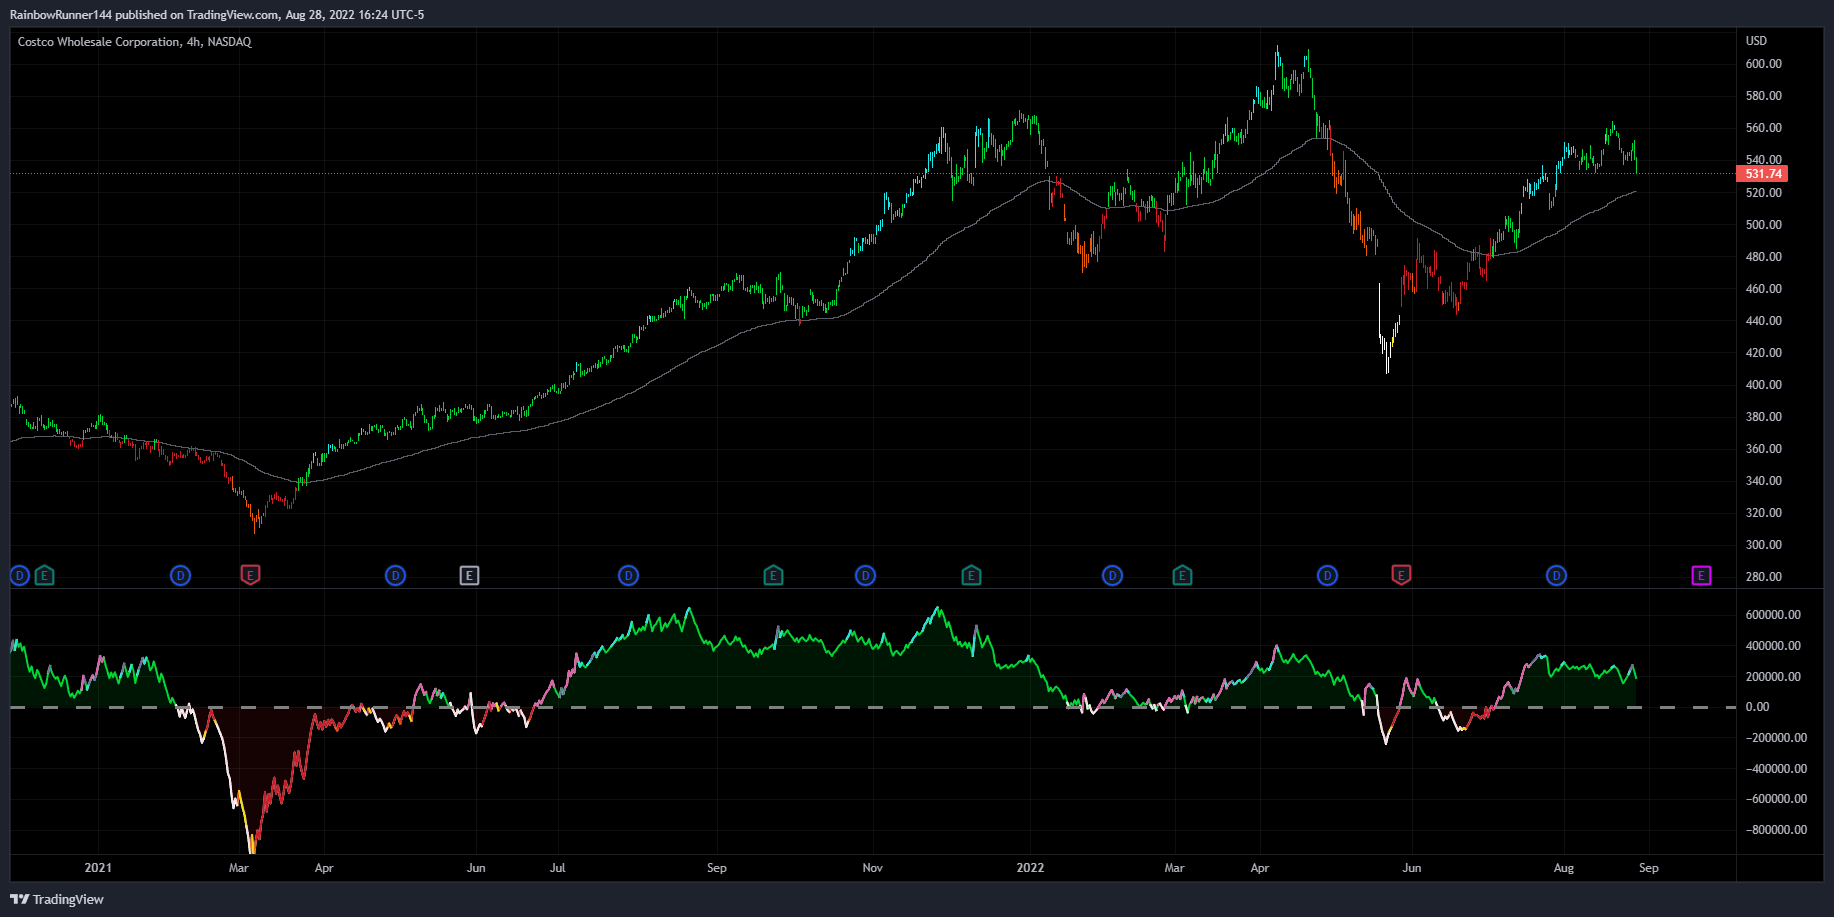
RT utilizes a spectrum of colors to display the varying levels of strengths that the whale’s deploy inside the market. Each color has been specifically coded to define the unique strengths/weaknesses of price action.
Whale’s are stealth experts and their strength is their ability to not be detected as they move the market. Rainbow Theory illuminates them from the shadows.This allows traders to learn the habits of these whales, how they move and the colors they paint.
Find your whales, learn their colors, tune your setup.
Track – Stalk – Trade
HOW THE COLORS WORK
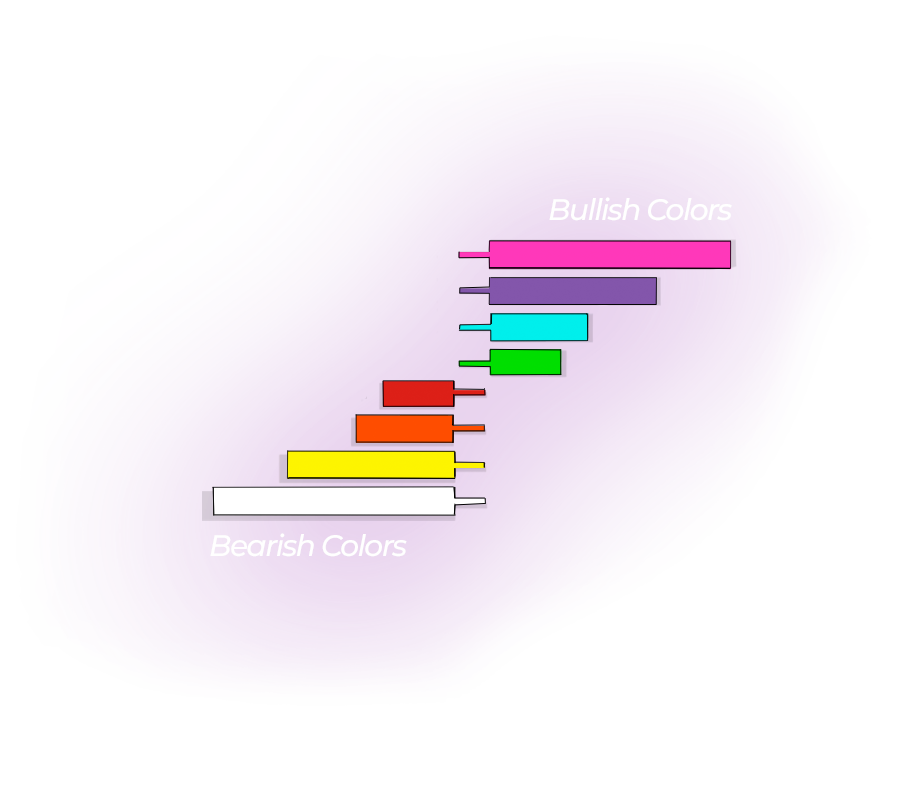
Bull Colors
- Pink – Strongest Bullish Color / Shortest Endurance
- Purple – 2nd Strongest Bullish Color / 2nd Shortest Endurance
- Blue – Stronger Bullish Color / Medium Endurance
- Green – Normal Bullish Color / Longest Endurance
Bear Colors
- Red – Normal Bearish Color / Longest Endurance
- Orange – Stronger Bearish Color / Medium Endurance
- Yellow – 2nd Strongest Bearish Color / 2nd Shortest Endurance
- White – Strongest Bearish Color / Shortest Endurance
Main Indicator
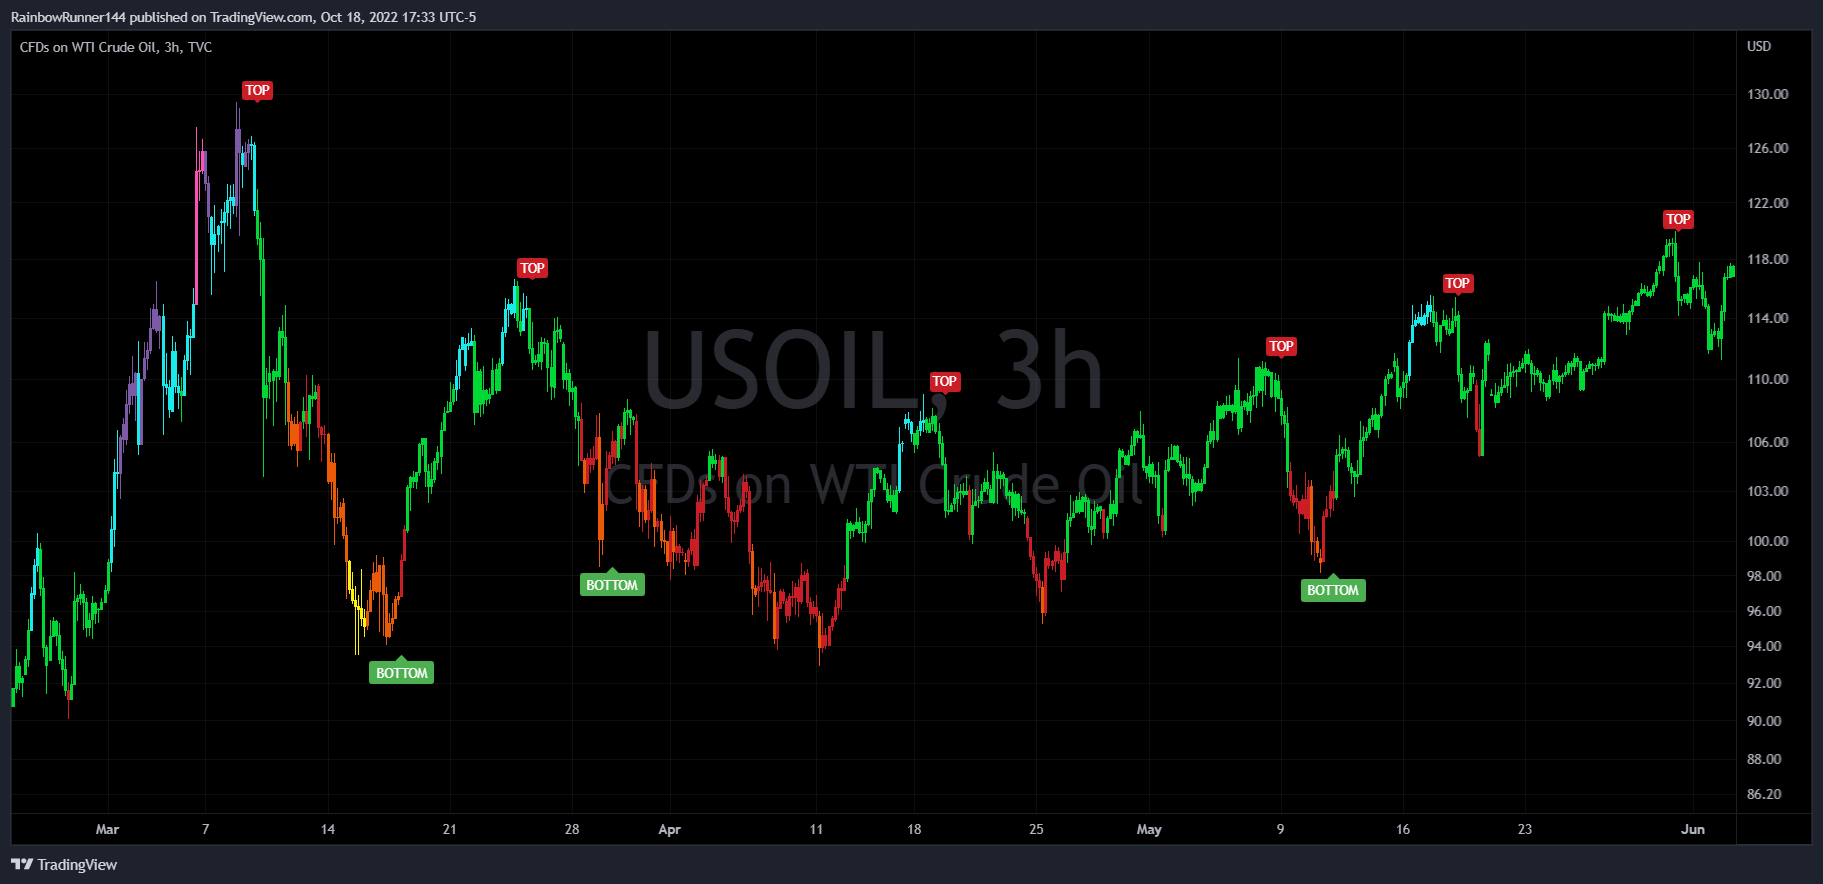
The main indicator that started it all. In development for over 5 years. This all in one indicator allows any trader to easily identify when market makers are buying and selling using multi-colored candles that change in real-time. This indicator also identifies key support/resistance levels with “Rainbow Pivots” and highlights unusual price movements with “Whale Print” arrows.
Liquidation Engine
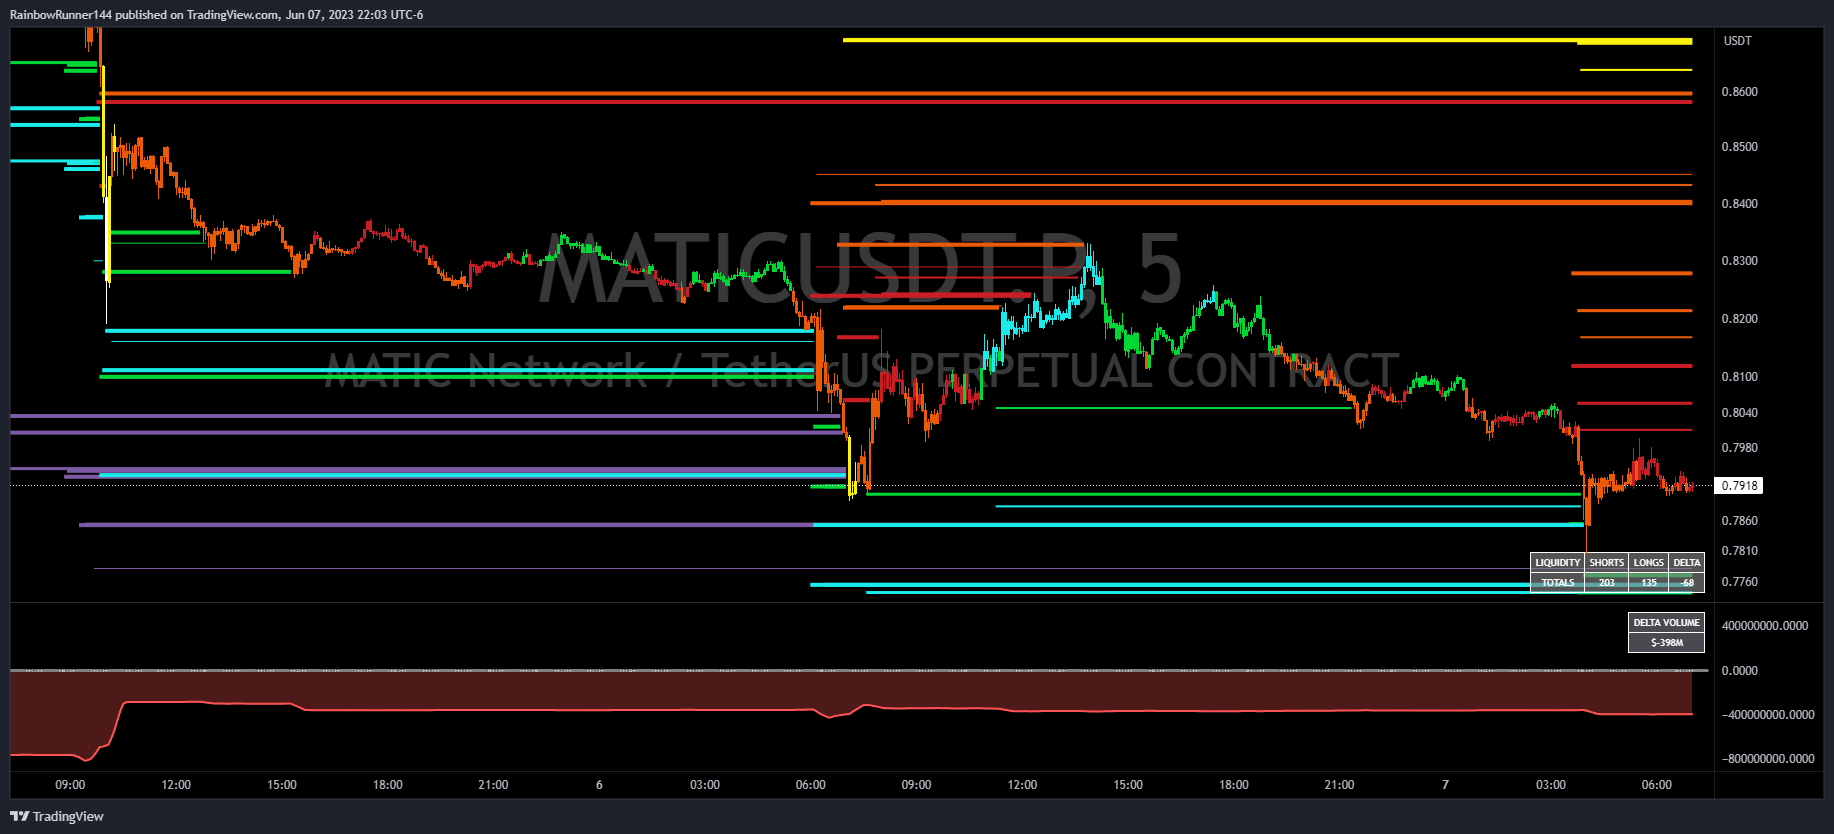
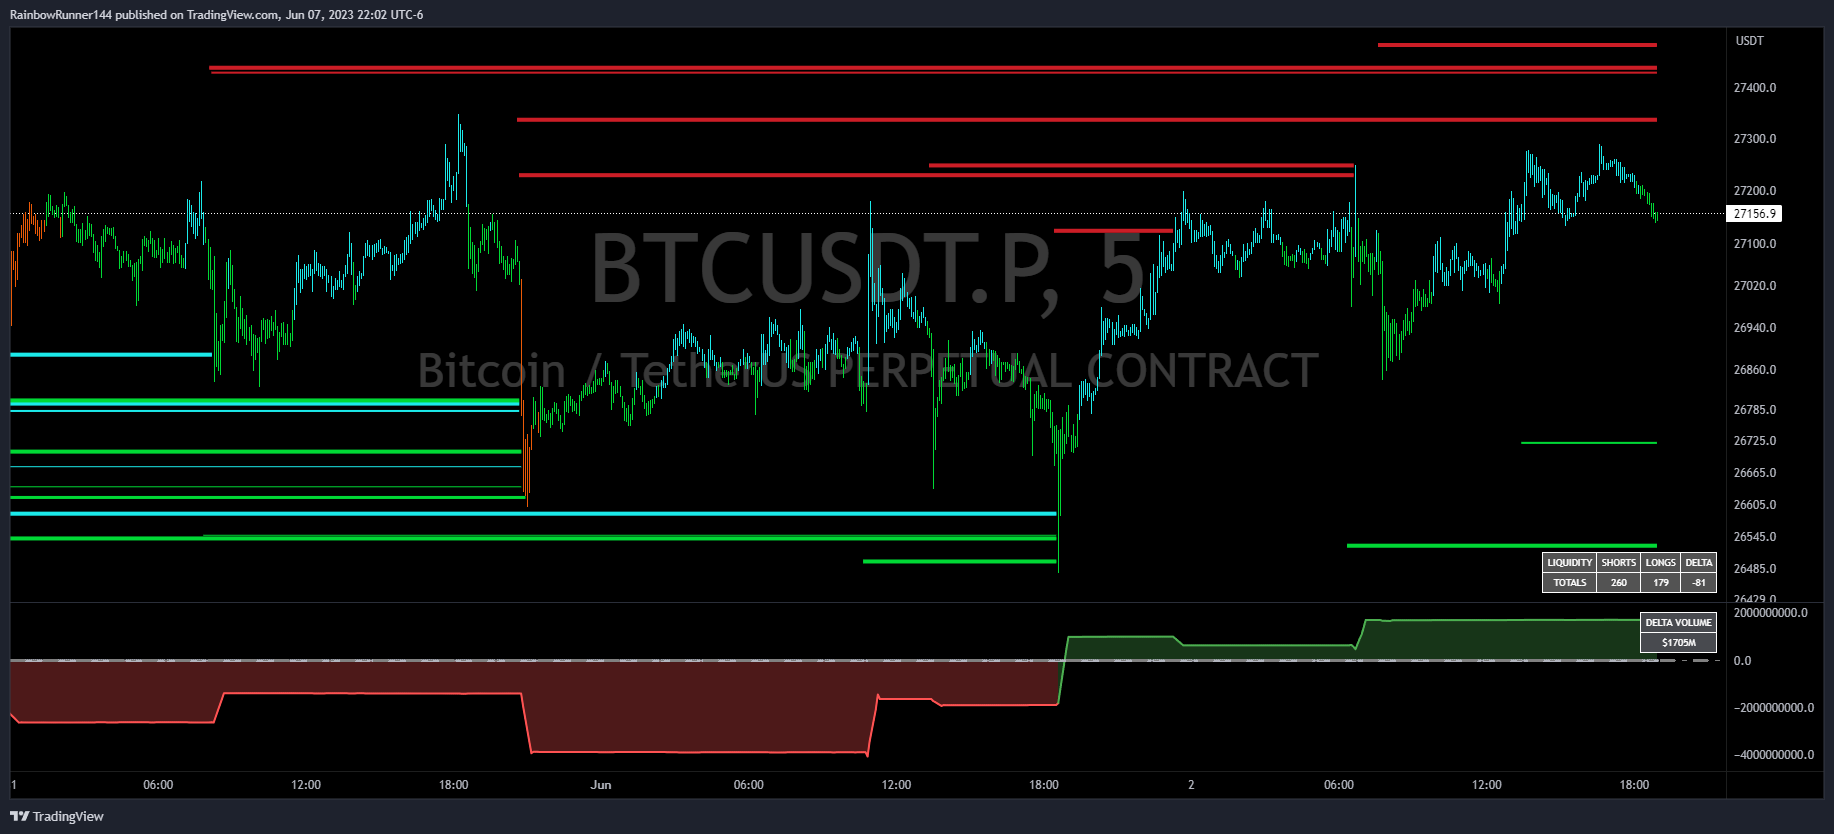
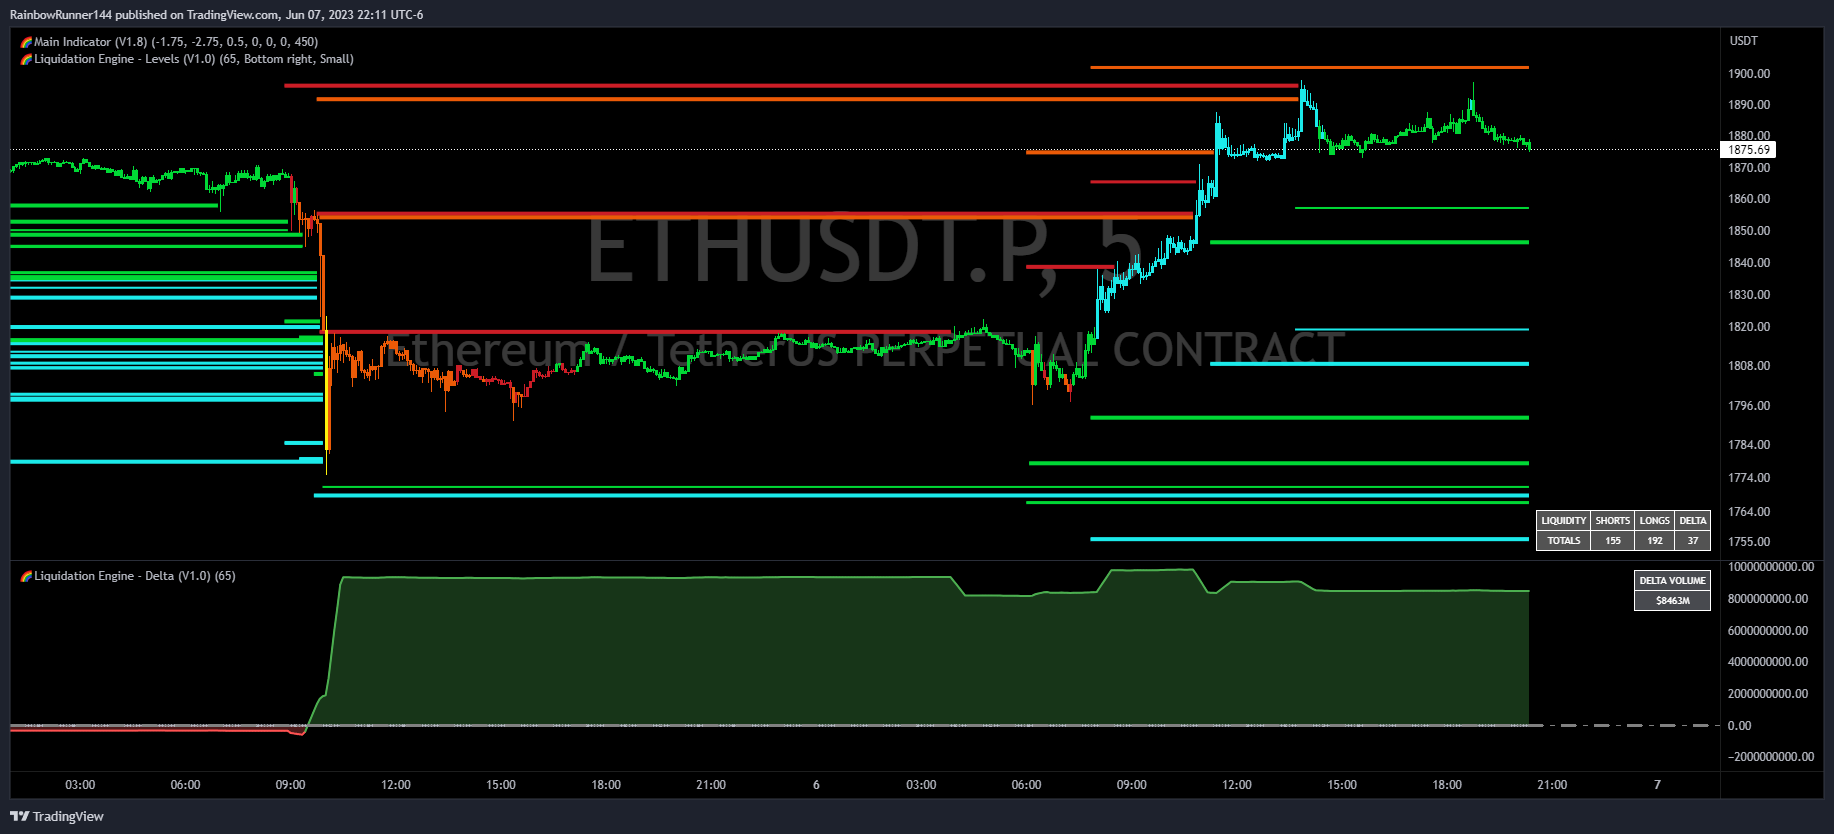
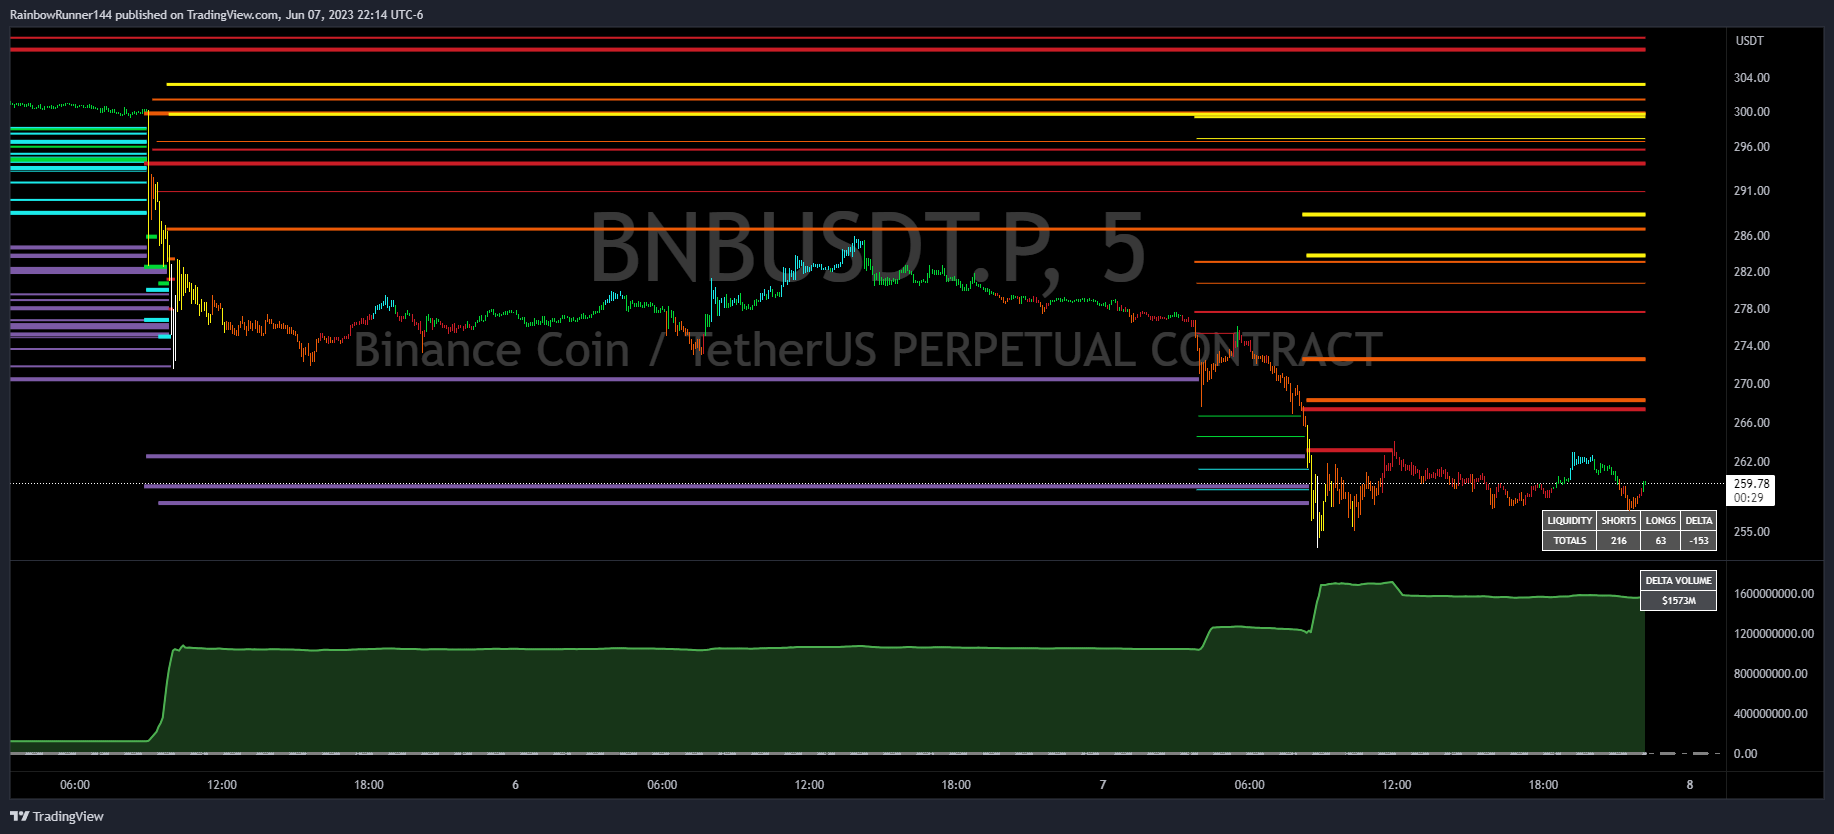
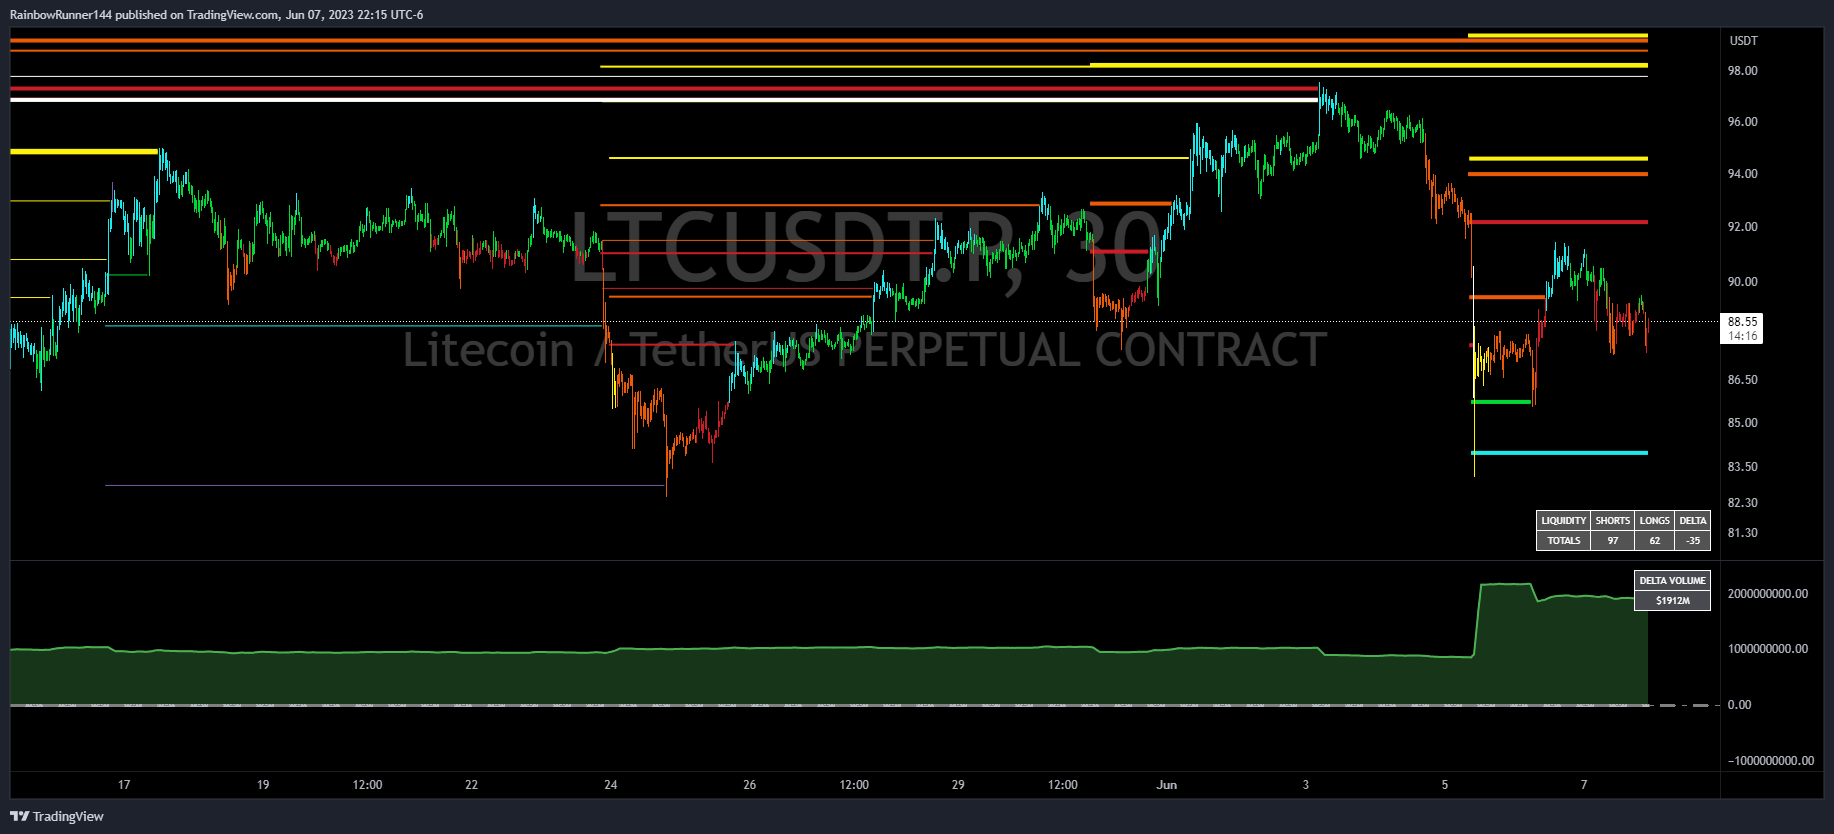
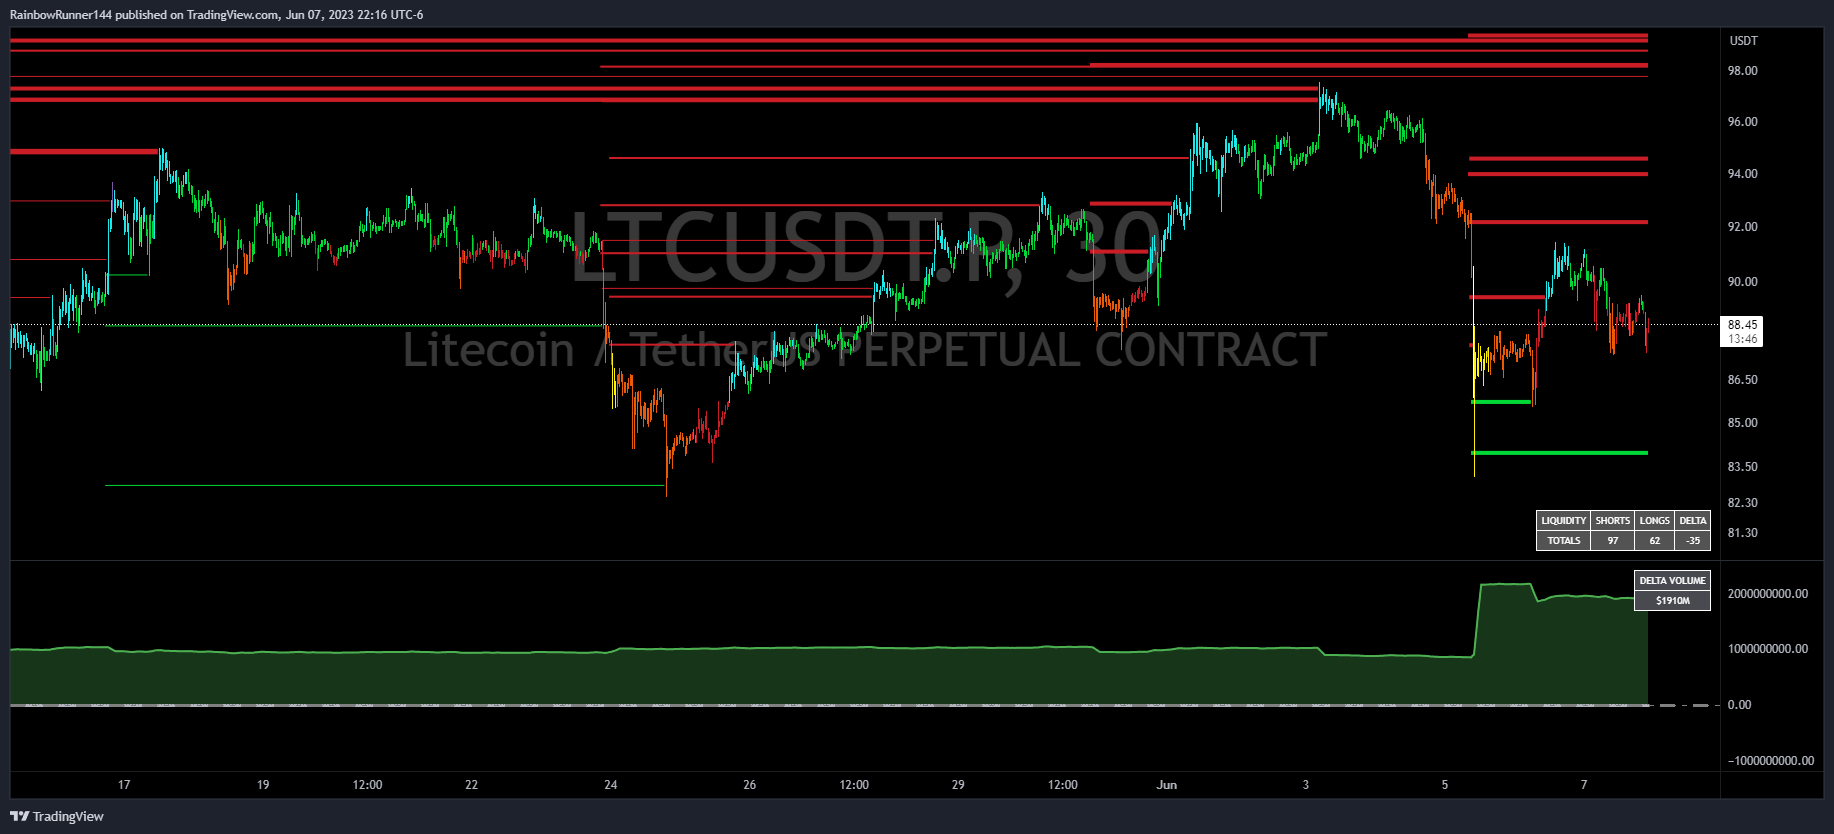
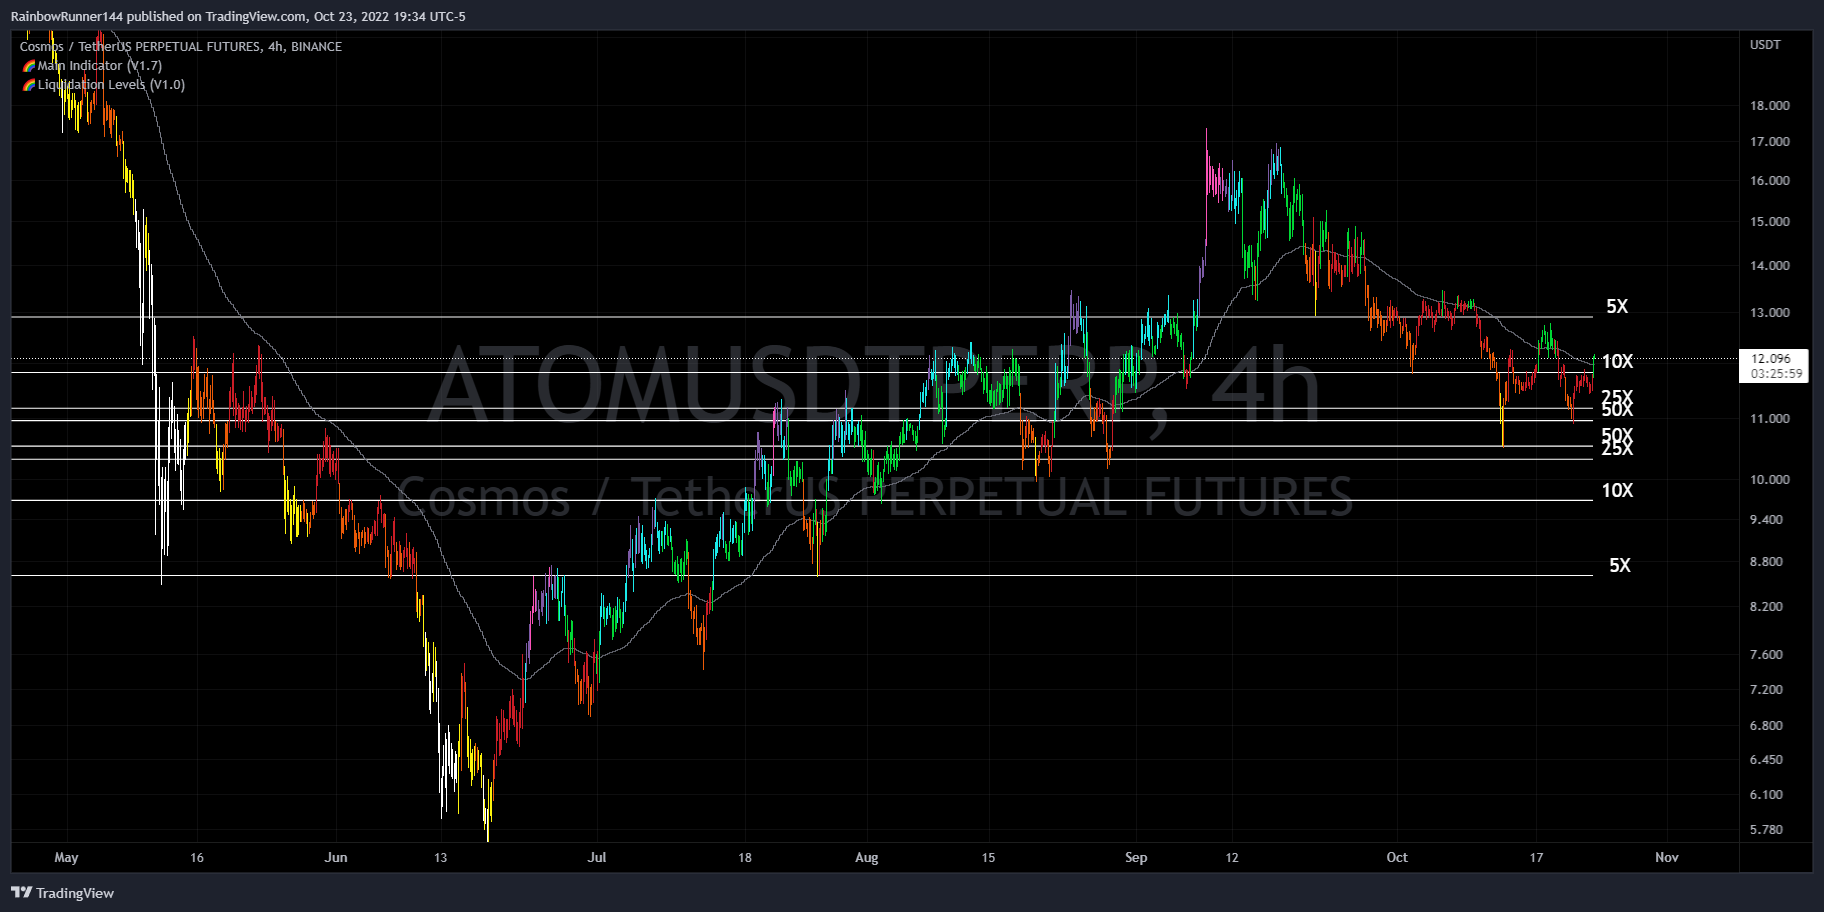
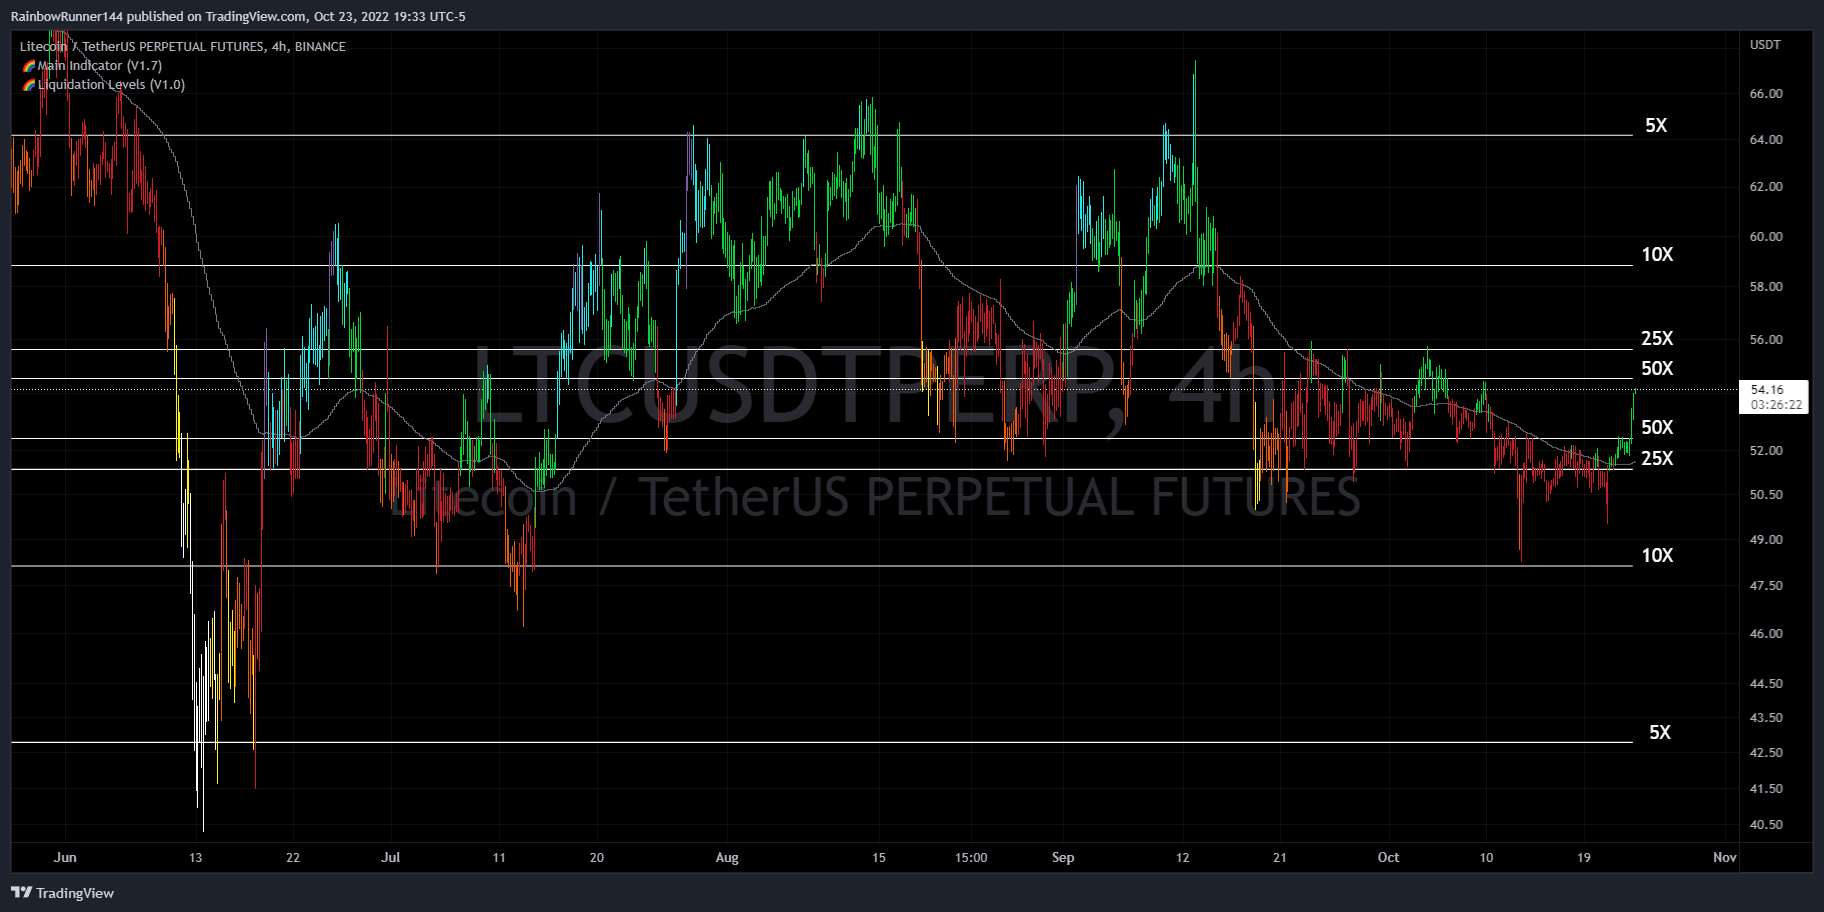
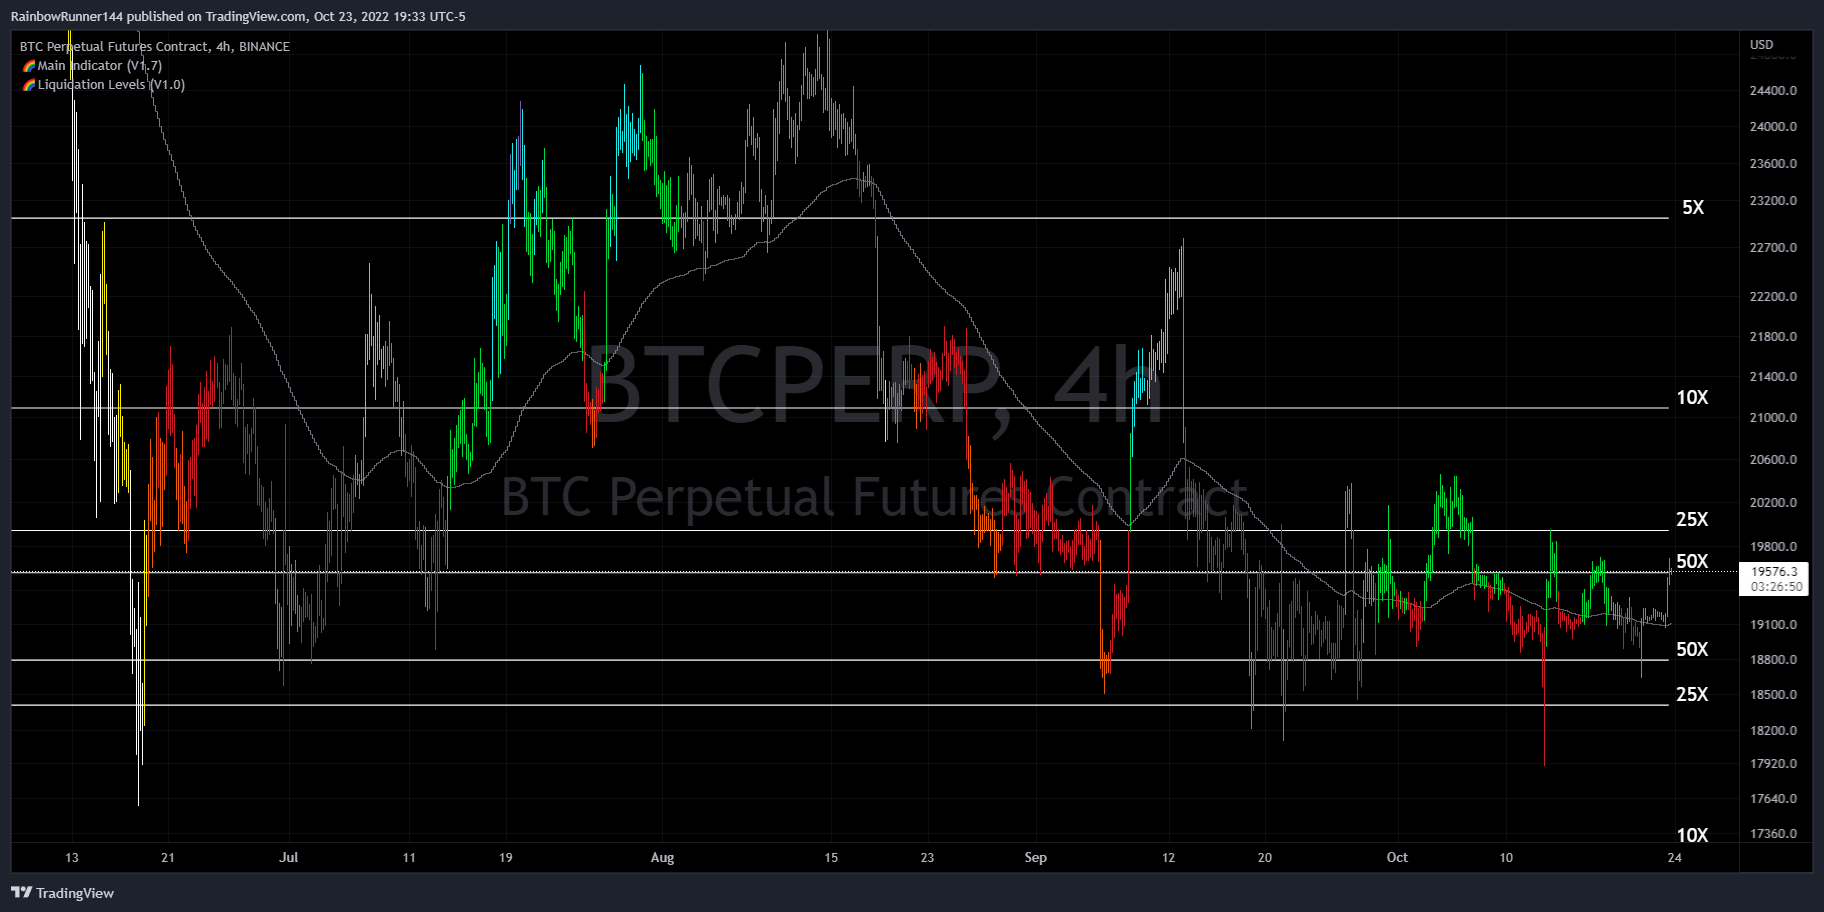
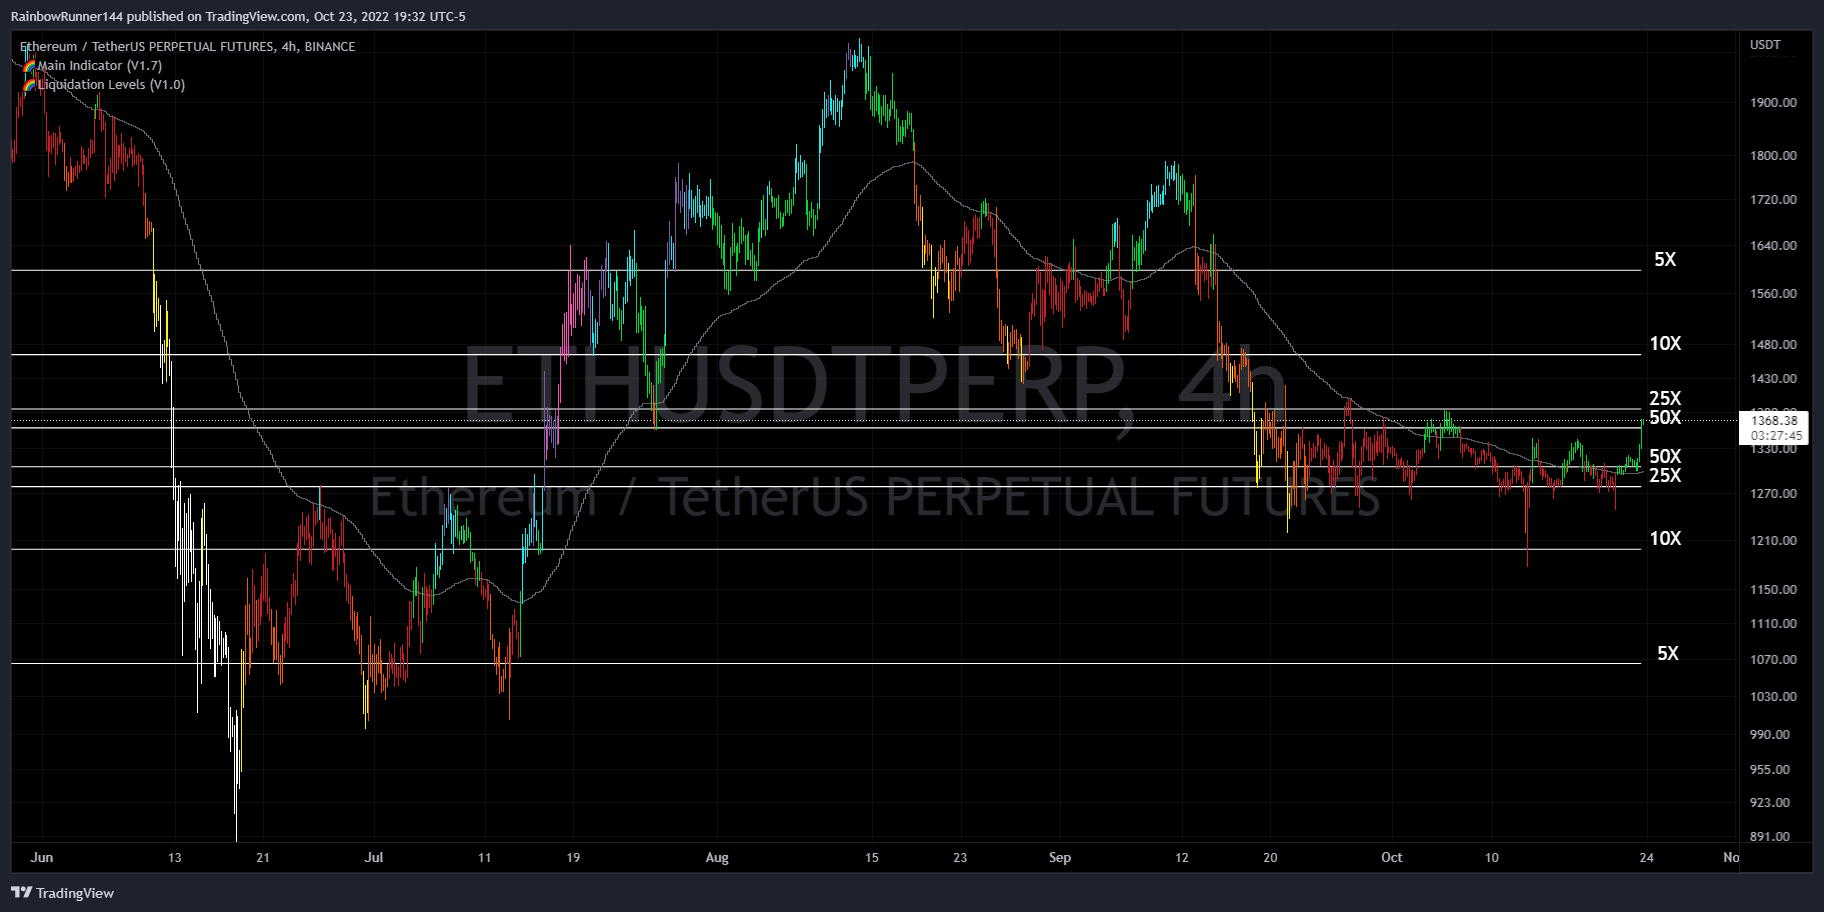
Liquidity Tools in trading serve the purpose of identifying and managing potential liquidation points for leveraged long and short positions. Our Liquidation Engine utilizes advance models that analyze volume anomalies to identify vulnerable price points where highly leveraged positions are vulnerable to being liquidated. This allows traders to anticipate and prepare for price levels that may trigger a cascade of liquidations in the market. Understanding these levels allow traders to make informed decisions to mitigate risk and optimize their trading strategies in the dynamic and fast-paced world of leveraged markets.
Runner Bot
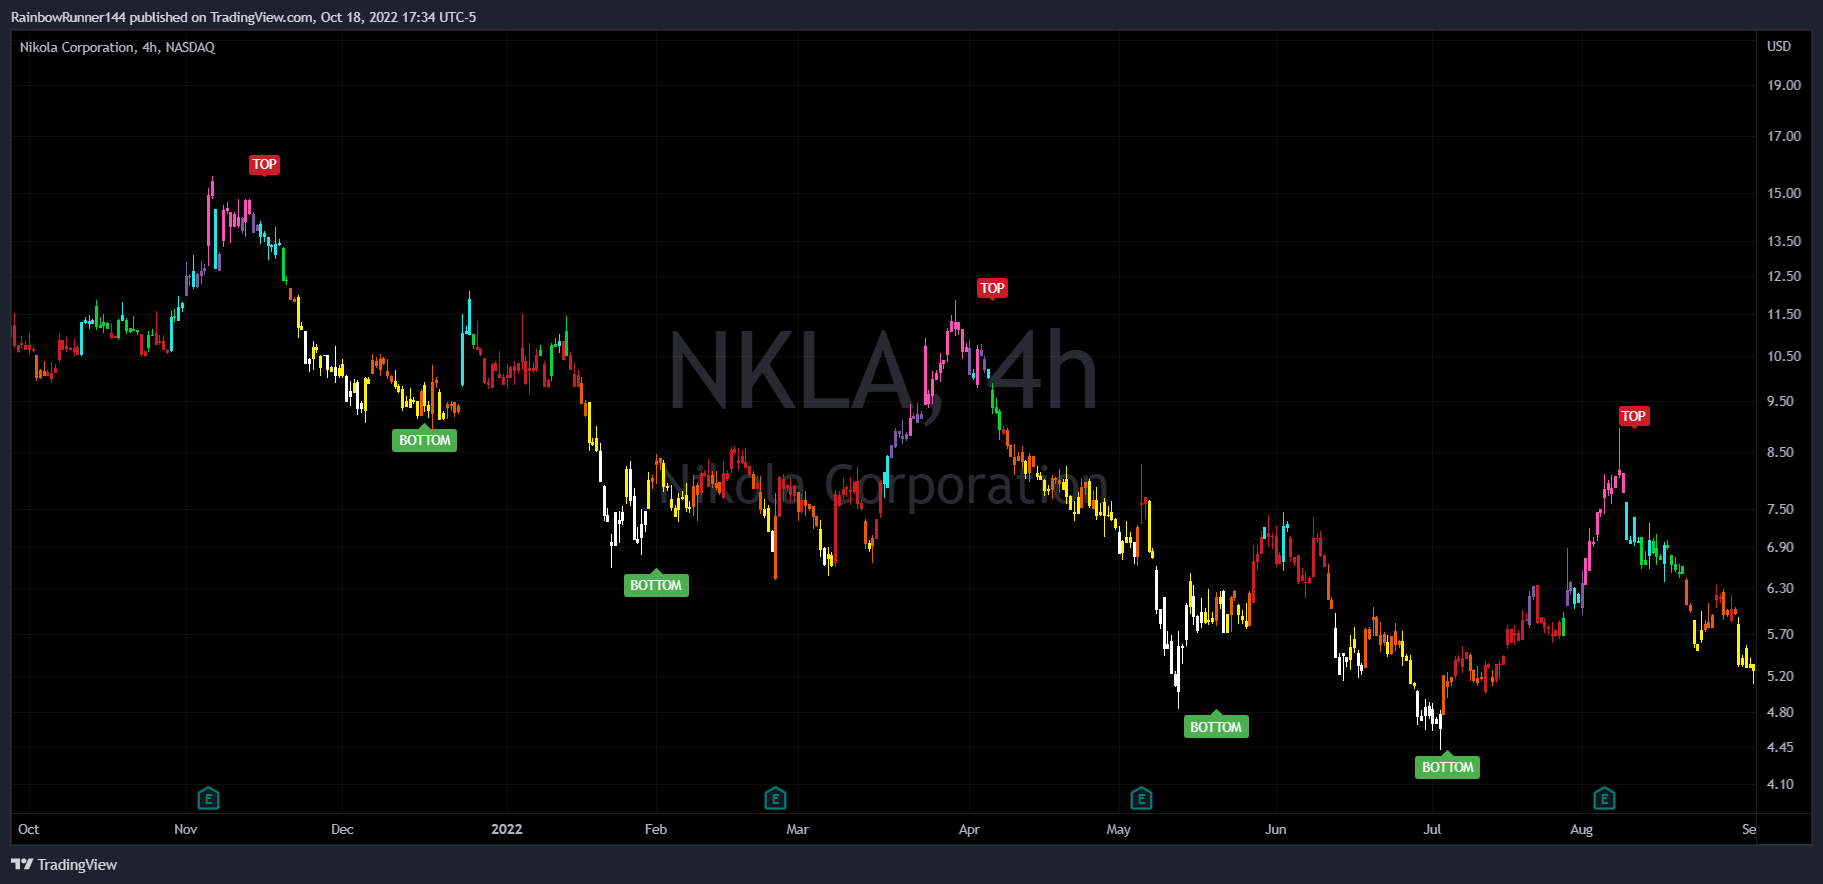
It’s dangerous to trade complex markets alone. The Rainbow Bot is an autonomous, auto-adjusting bot/algorithm designed to trade ANY market and help traders identify key tops and bottoms on any time frame to help you trade with confidence. No other indicator on the market can trade Tesla, Oil, Bitcoin and Doge all at the same time on the same settings.
RSI Divergence X's & HMA
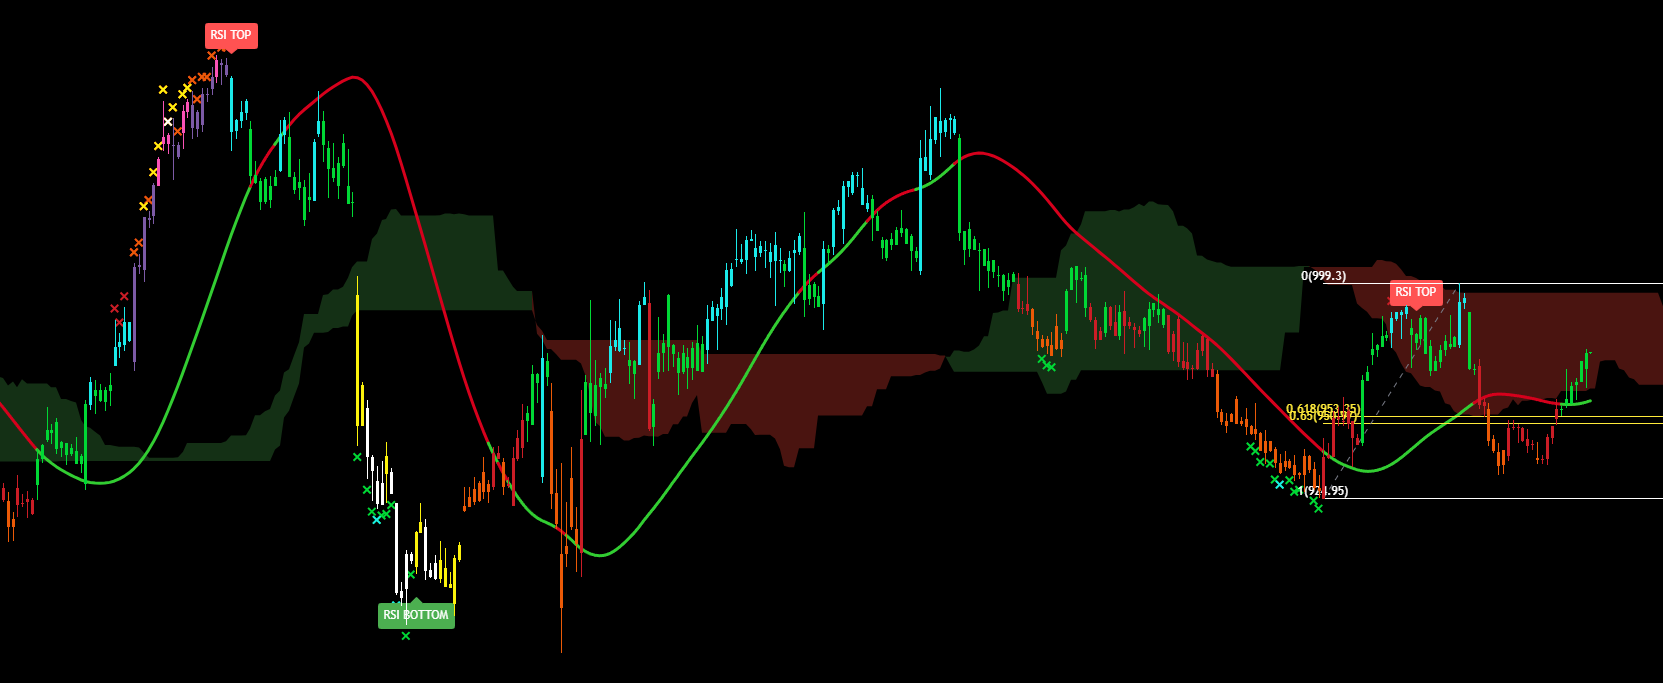
One of our most simple, but deadliest tools. This provides an incredibly simple visual display to spot potential trend changes in RSI. The “X” markers allow the trader to visually identify when RSI is being blown out and starting to rotate. Often times, these rotations highlight key pivot areas where bulls/bears are near exhaustion and ready to change the direction of the trend. This will become an everyday tool in your arsenal. A “basic” version is also available as a free indicator and a great way to test it.
Machine Learning
Reversion Bands
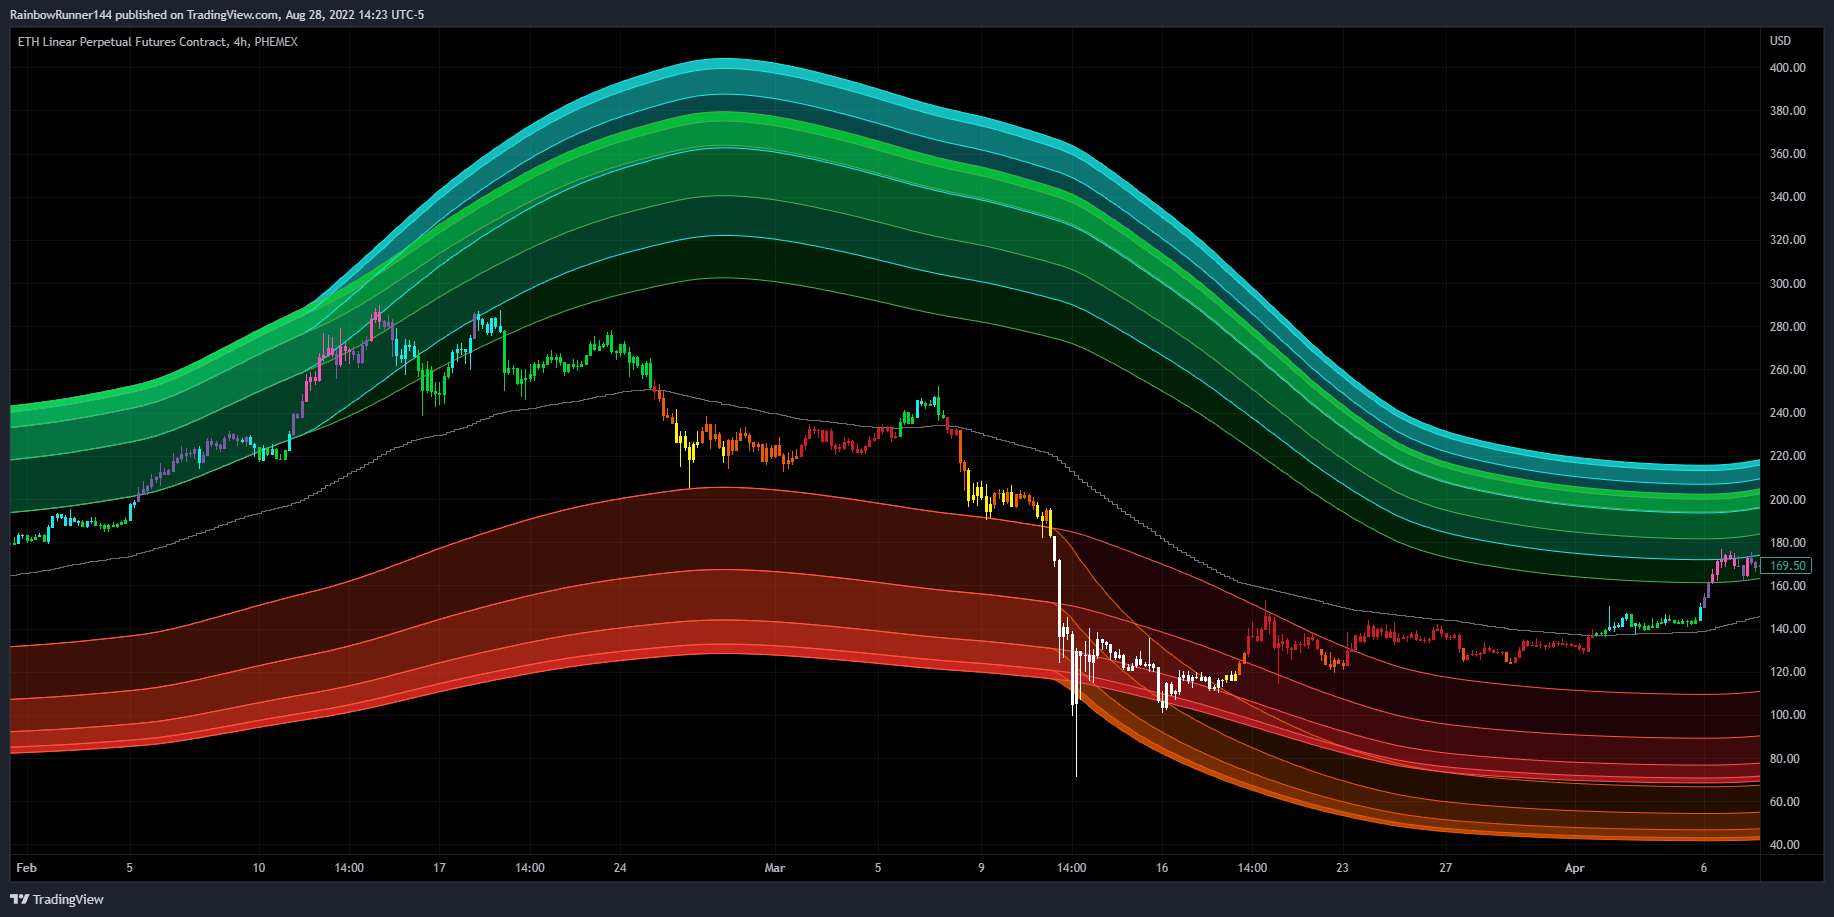
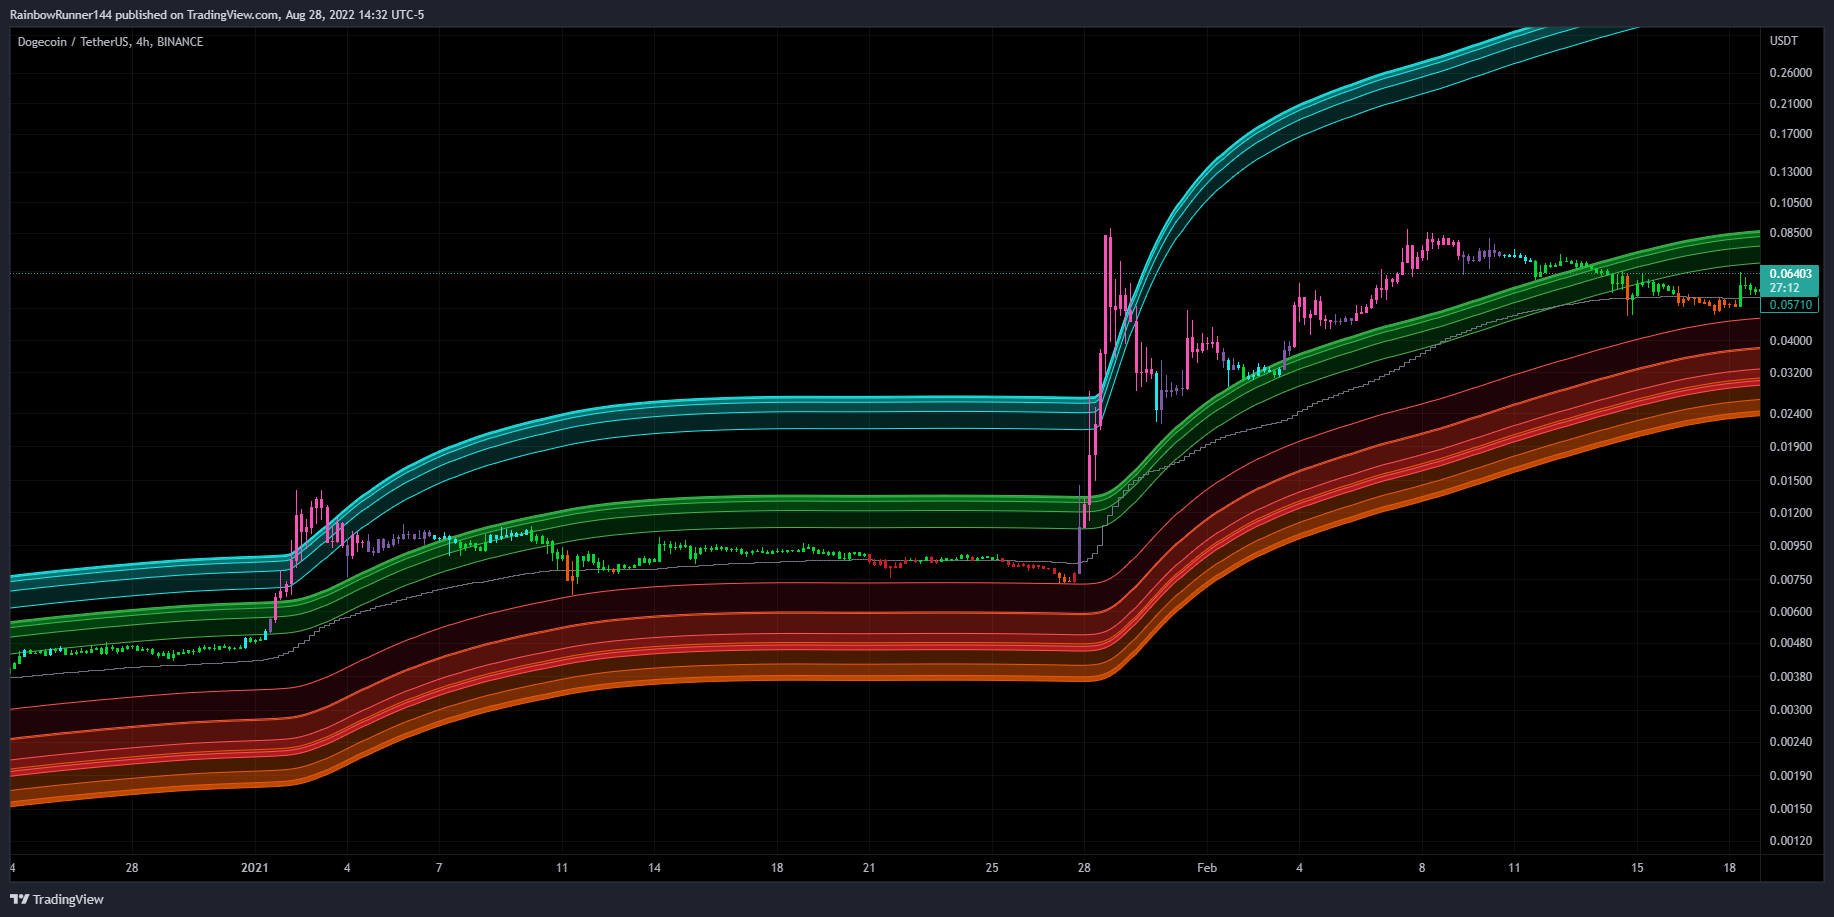
A Machine Learning upgrade to our Free Rainbow Reversion Bands Tool that utilizes an algorithm that learns from the chart’s ENTIRE history. A trader can scan through years worth of data or let this tool do it for you. This upgrade retains the original red and green Reversion Bands, but it also includes a second set of bands that learn and adapt to the chart’s volatility over time. This gives the trader four levels to trade from. The first two levels are the traditional support/resistance red/green Reversion Bands. The second levels are the orange/blue Machine Learning Bands. While the red/green bands are great at identifying traditional levels, the orange/blue bands allow the trader to know the EXACT levels that have “never been done before”. This is exceptionally valuable to help you find key entries and exits when trading more volatile assets.
STANDARD LIQUIDATION LEVELS
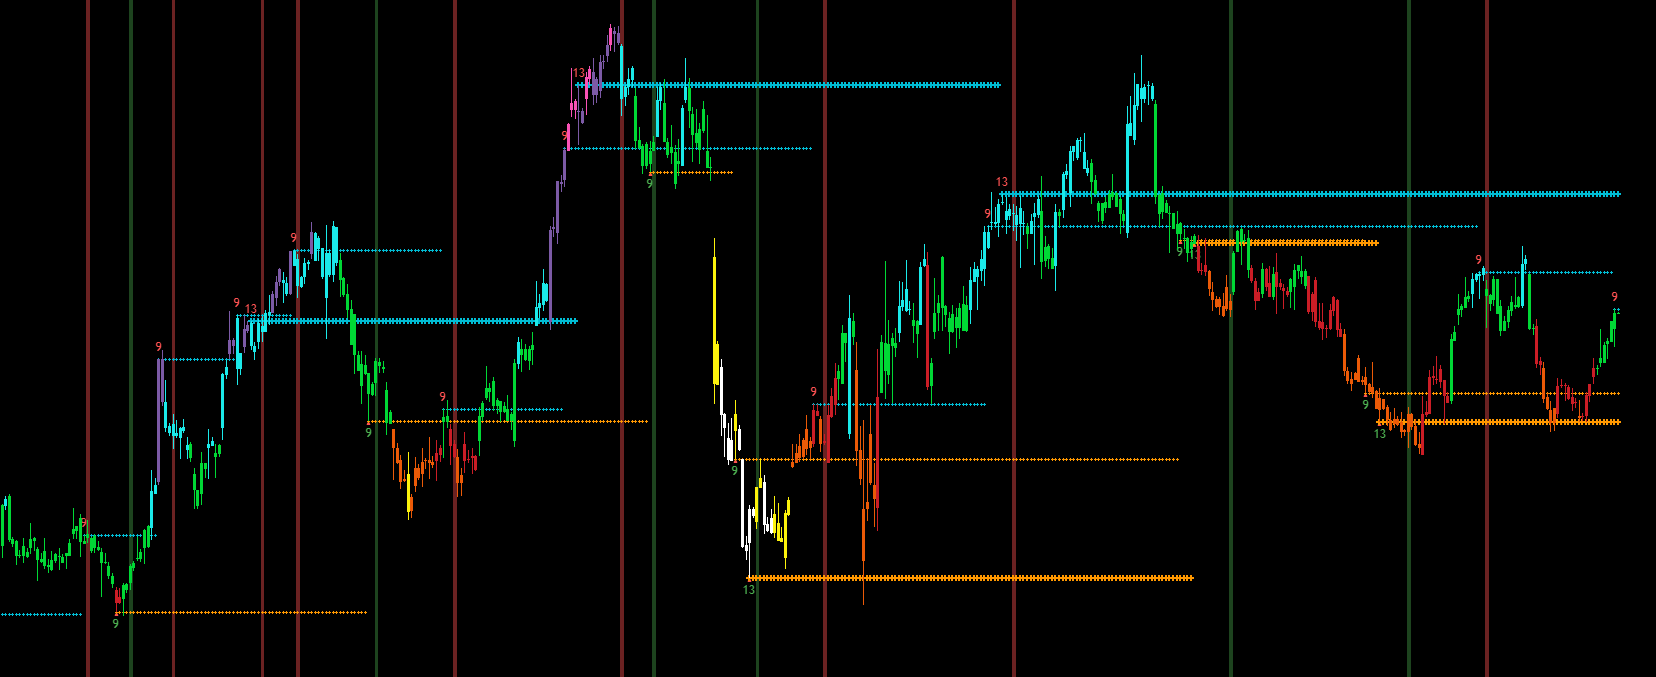
RT’s Standard Liquidation Levels is an algorithm that searches for the largest clusters of bids for bears/bulls. It then takes this cluster and translates it into a visualization at which each level of leverage would be liquidated. This is the precursor to the Liquidation Engine.
Mayer Multiple
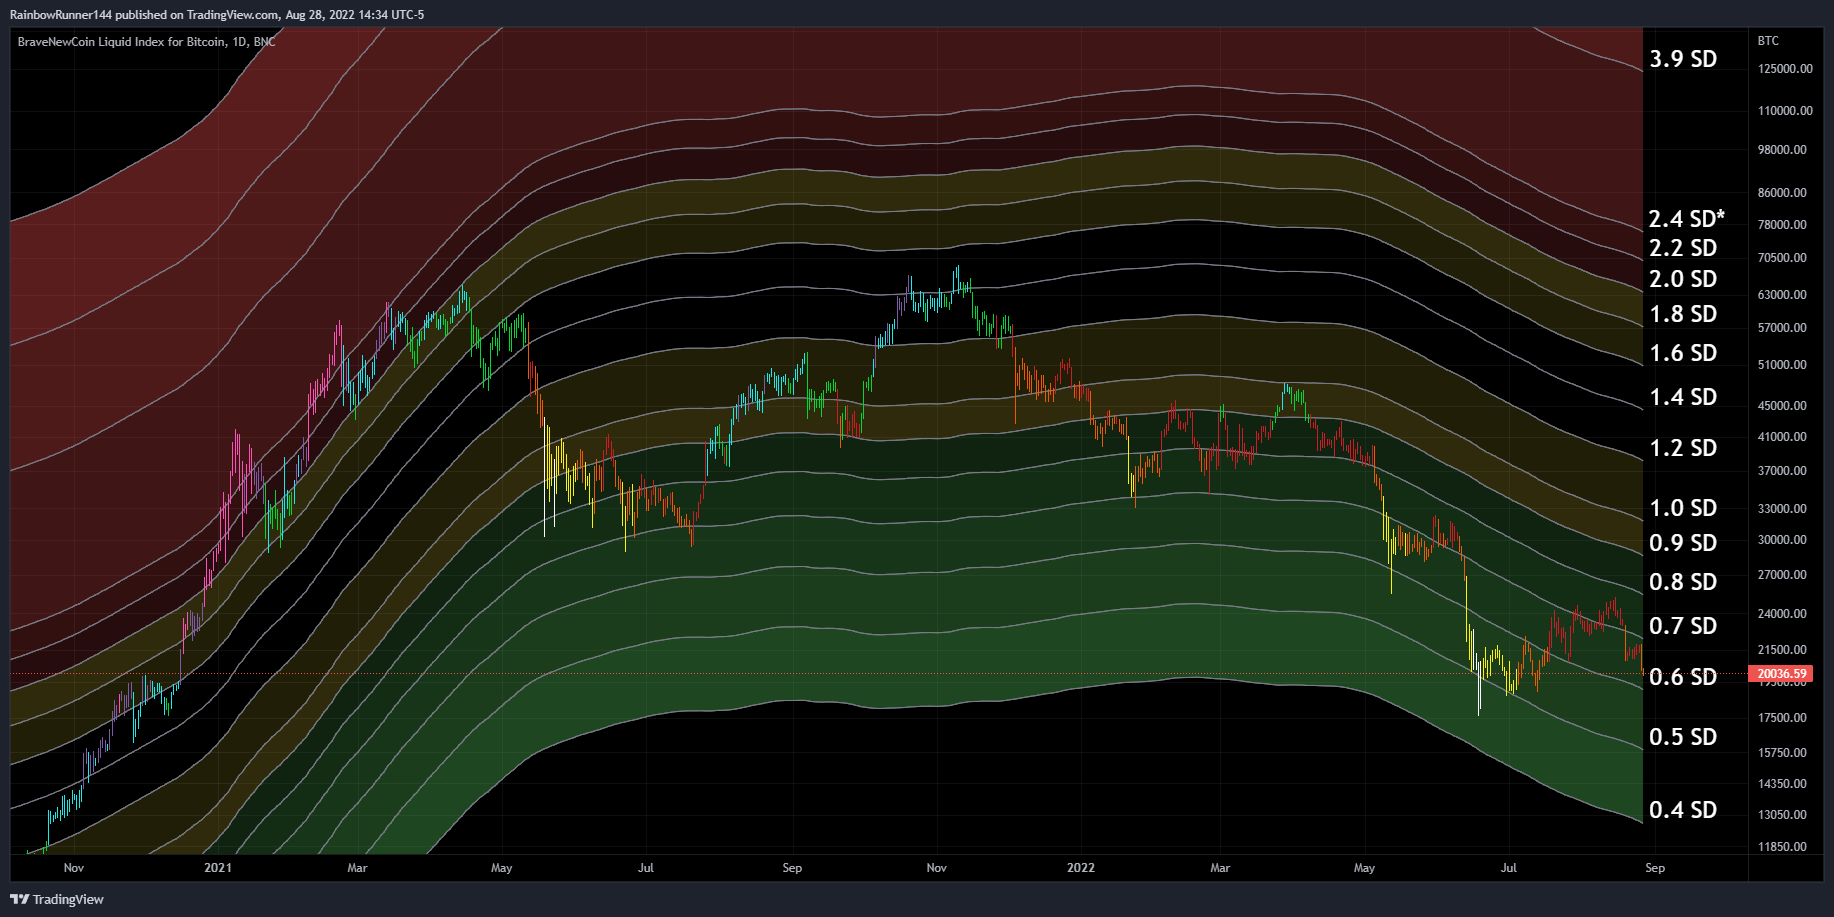
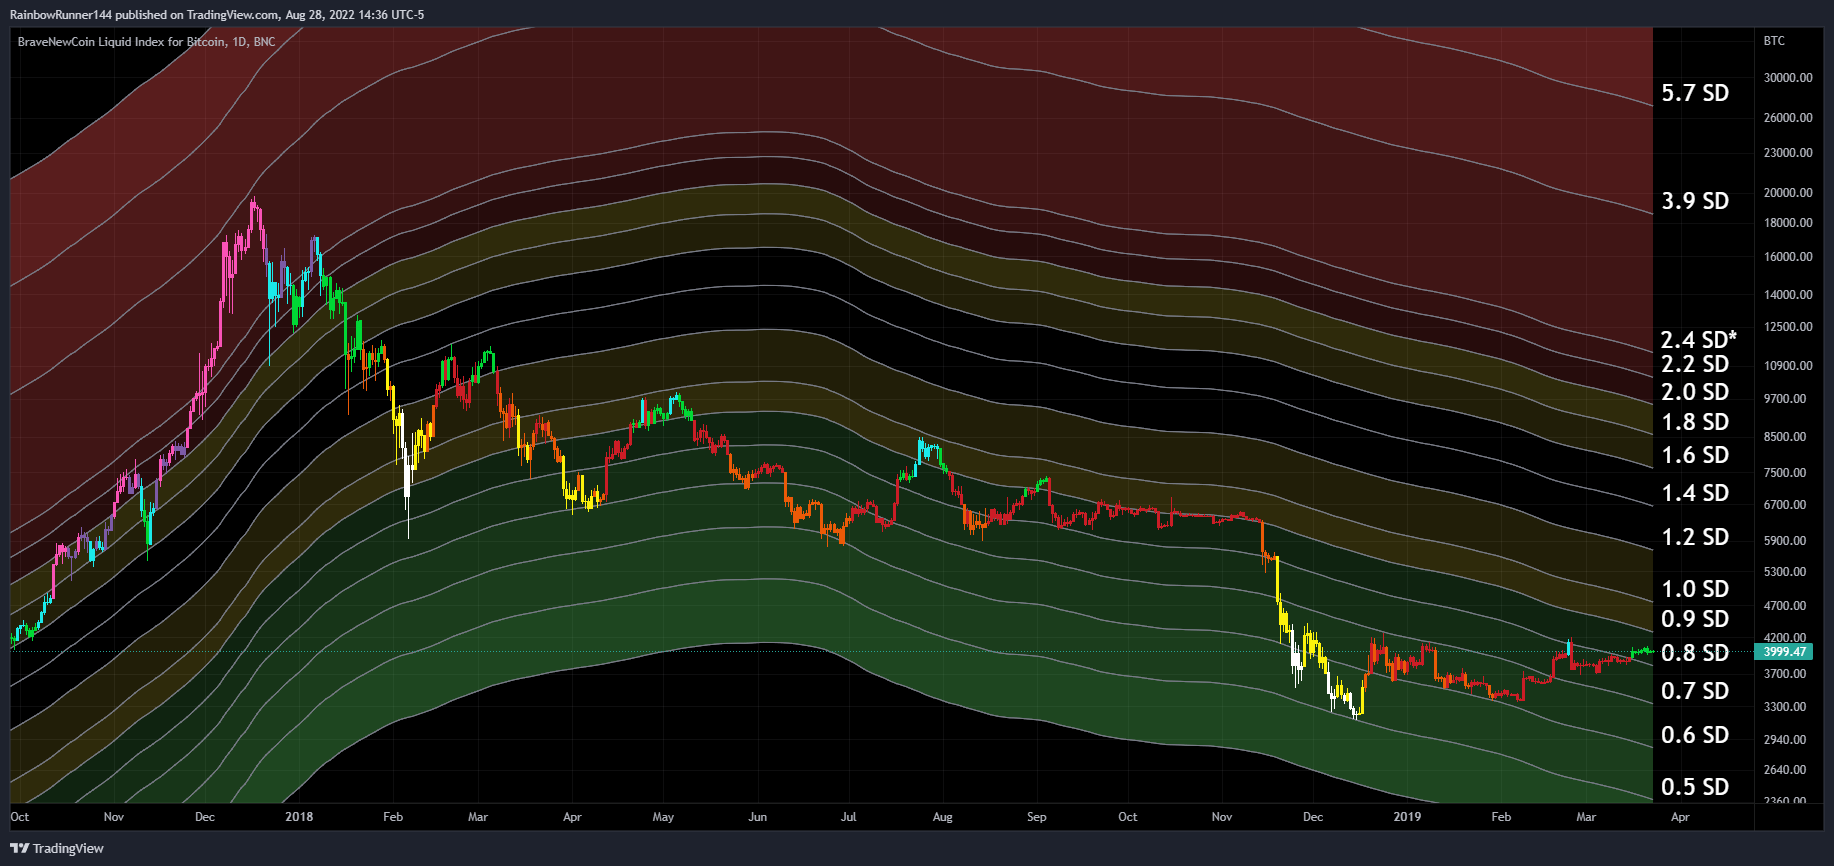
The Mayer Multiple is normally displayed as a raw number that does not give the Mayer Multiple justice or the respect it deserves. This Rainbow Trend version overlays the Mayer Multiple’s standard in a visual way that properly displays the standard deviation levels used by the Mayer Multiple.
Anchored OBV
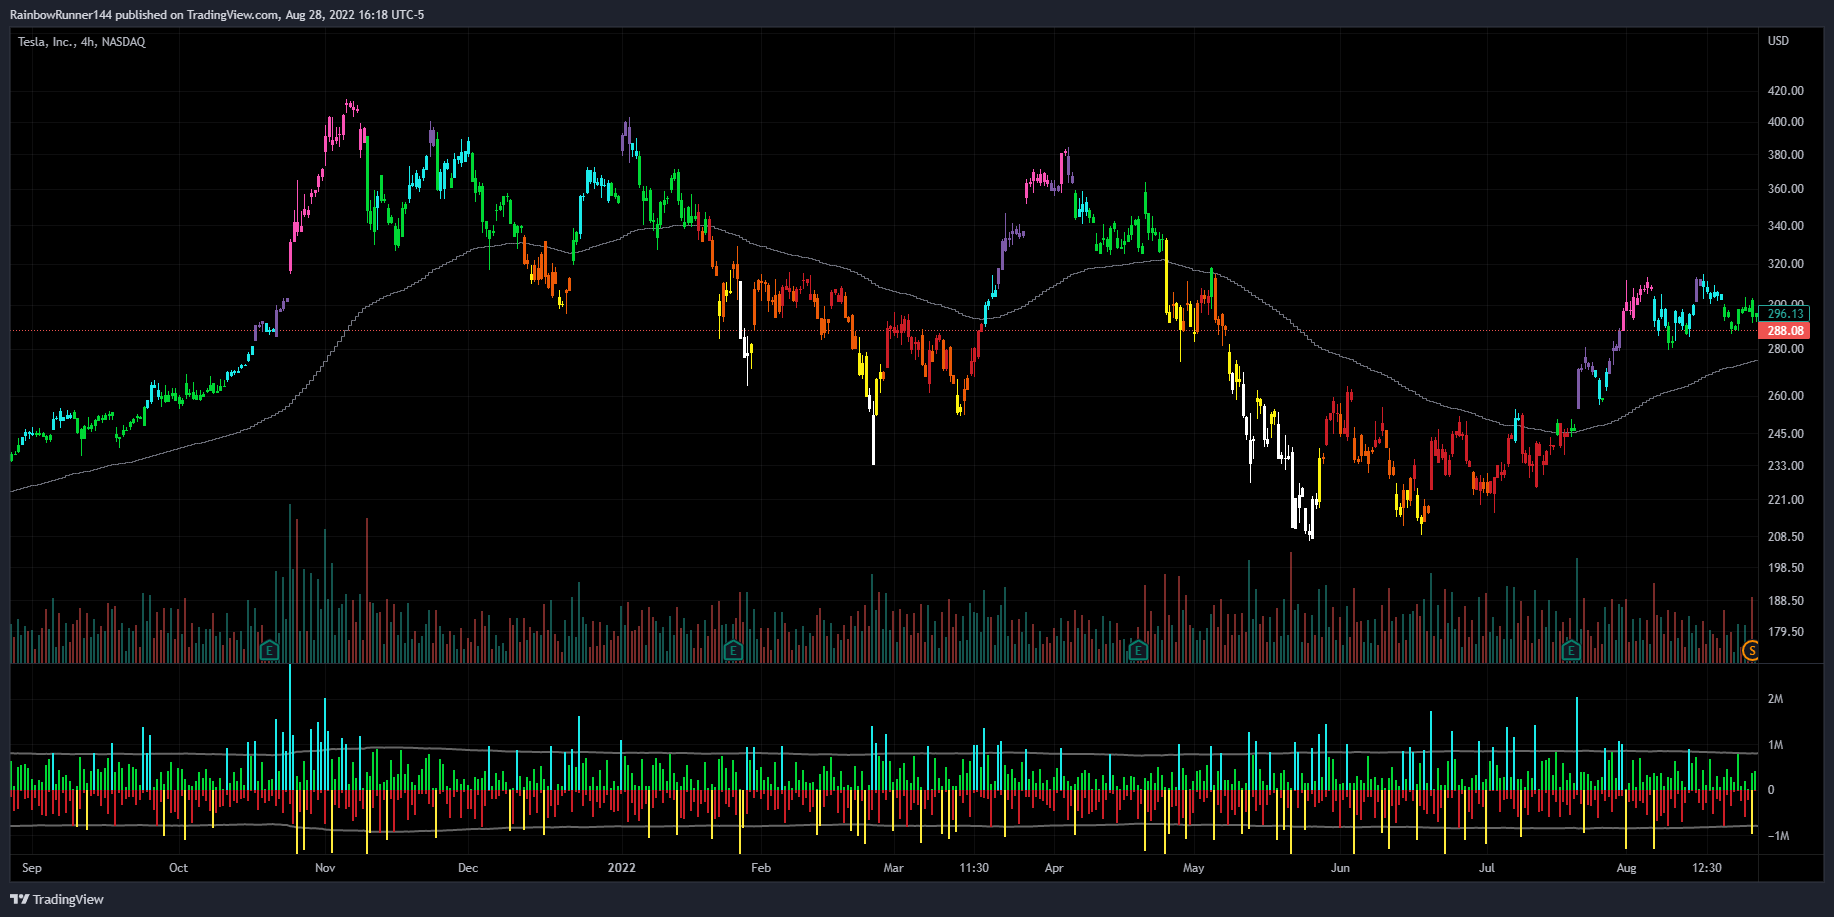
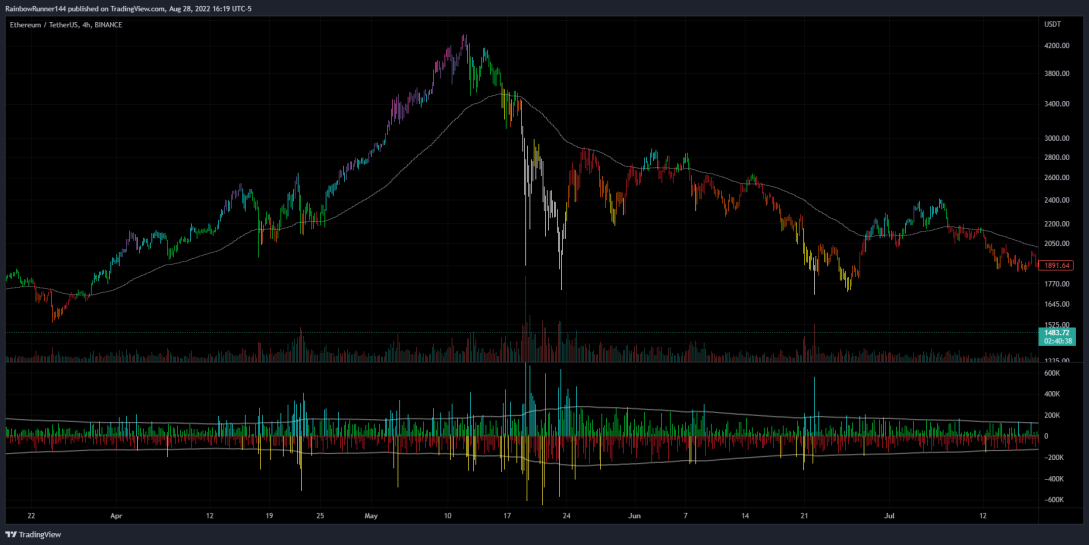
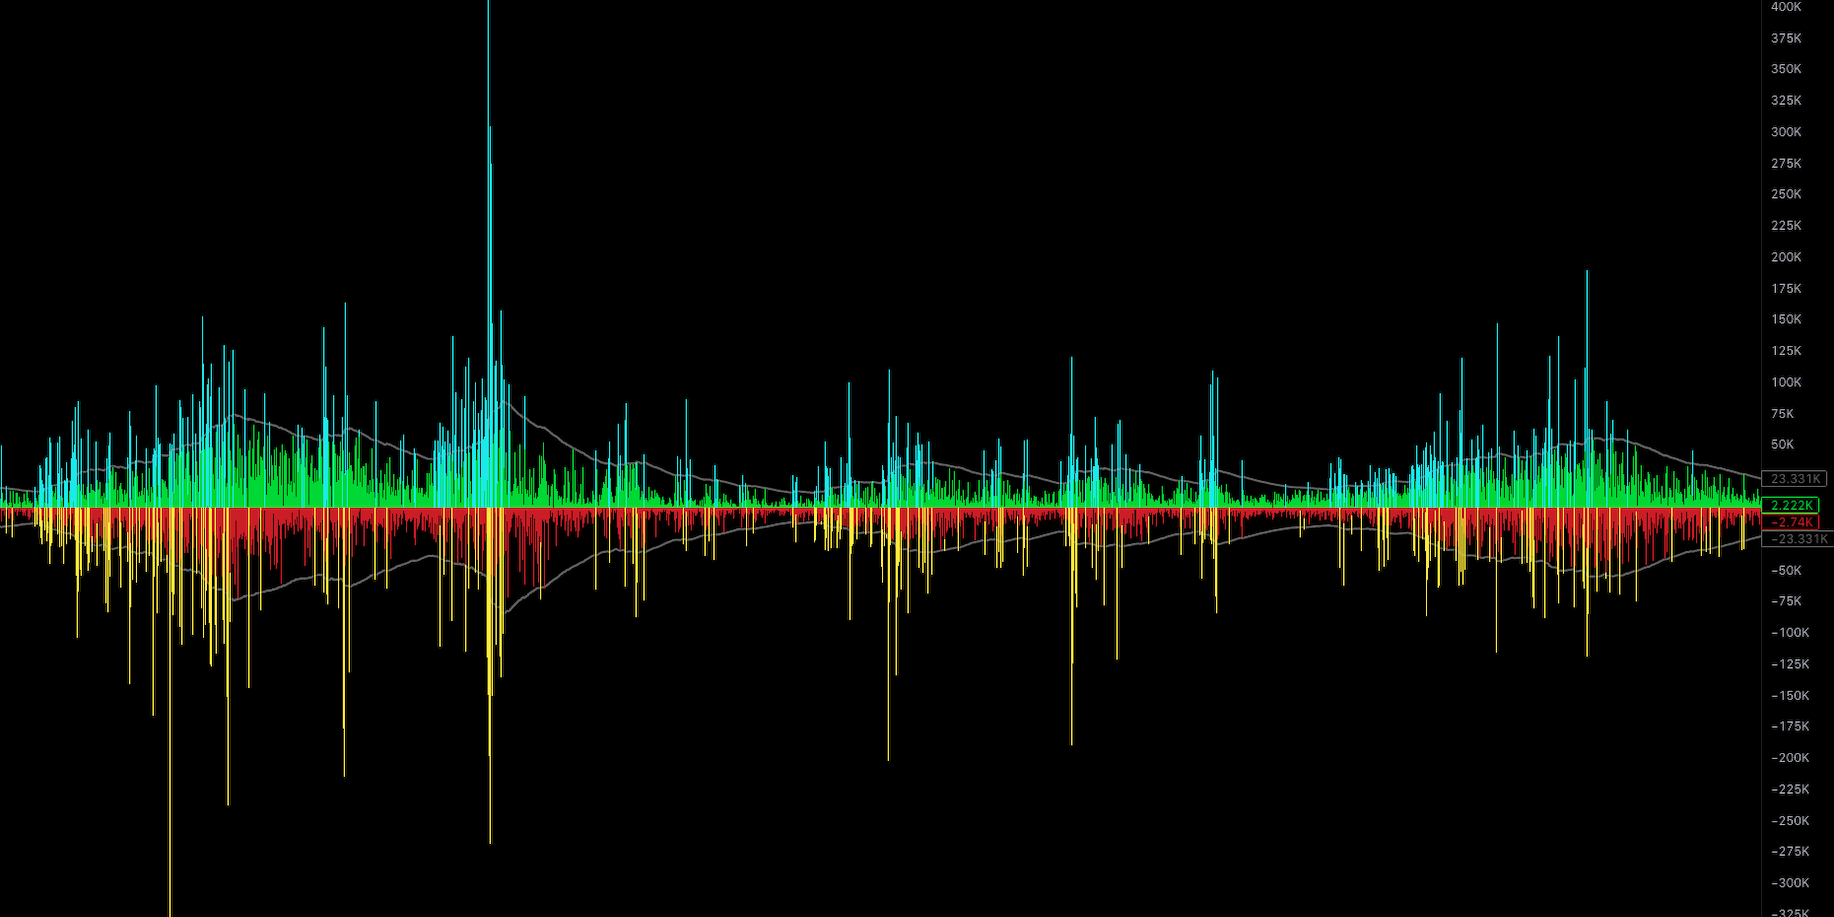
Split Volume
Traditional volume tools only show you the data for the candle that won. This leaves traders in the dark to the real buying and selling of the whales. Often a candle closing is a photo finish between the bulls vs bears and other times it is a one sided fight. The Rainbow Trend Split Volume Indicator gives our traders the advantage to be able to see both sides of the book in real-time and it also identifies which candles have been flagged as anomalies from the rest of the adjacent volume bars. This indicator takes the guess work out of when large market makers are entering or exiting a position and puts you ahead.
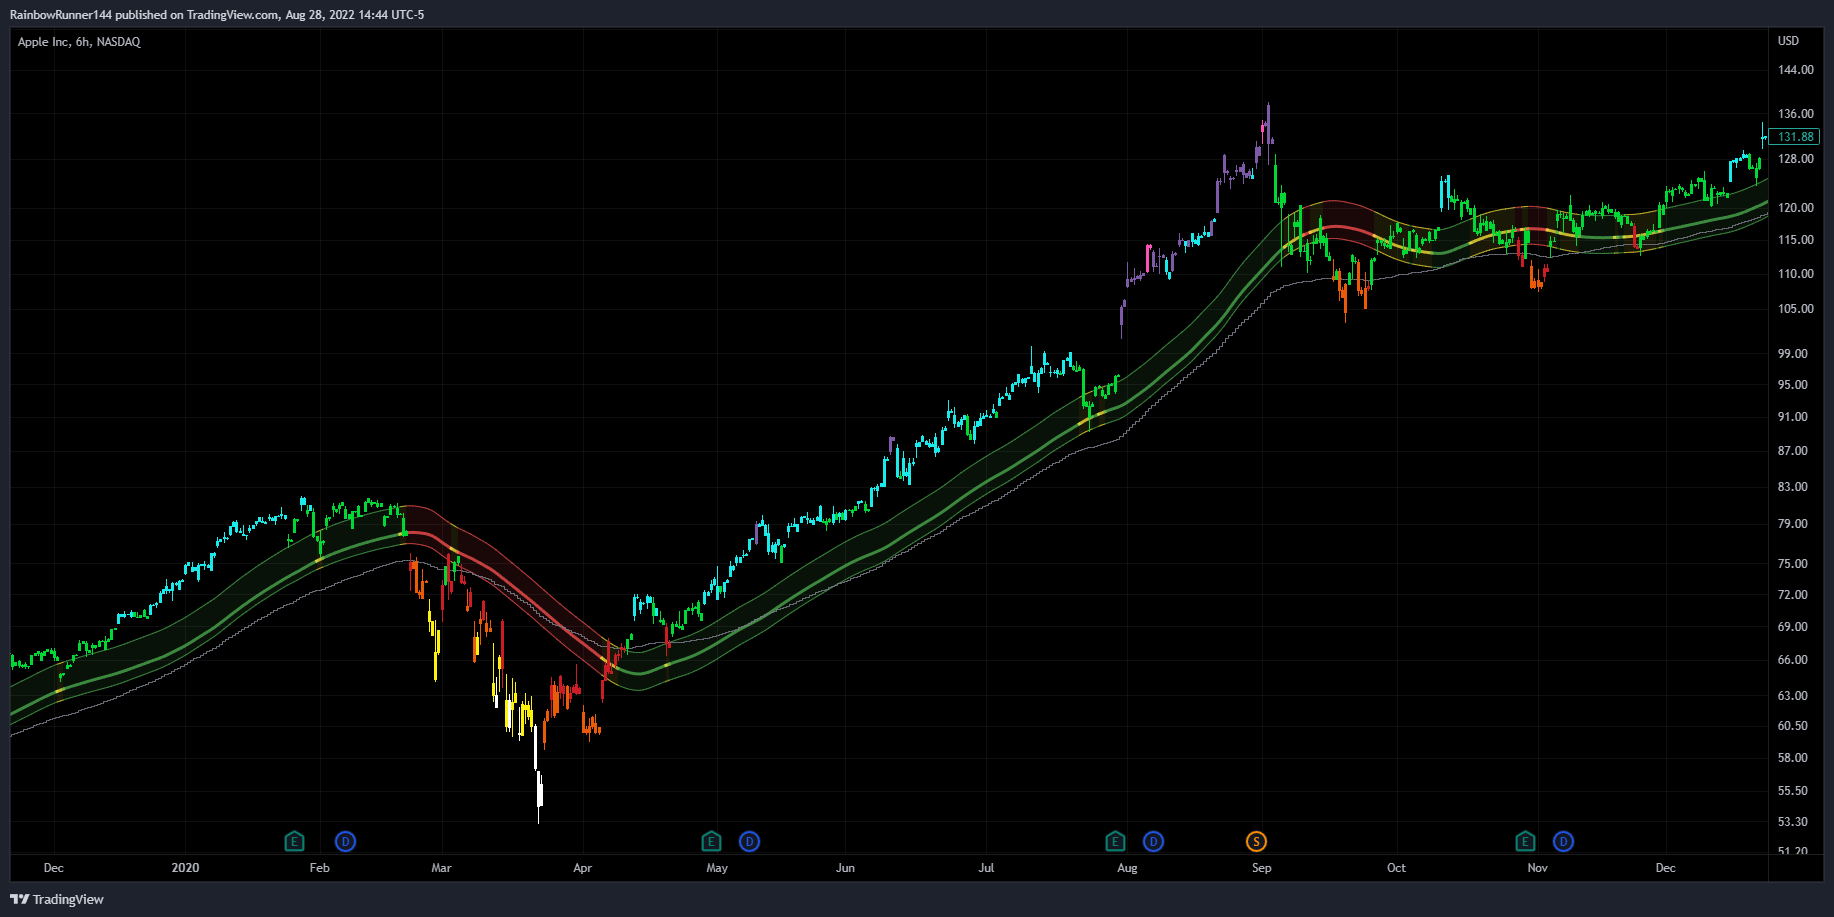
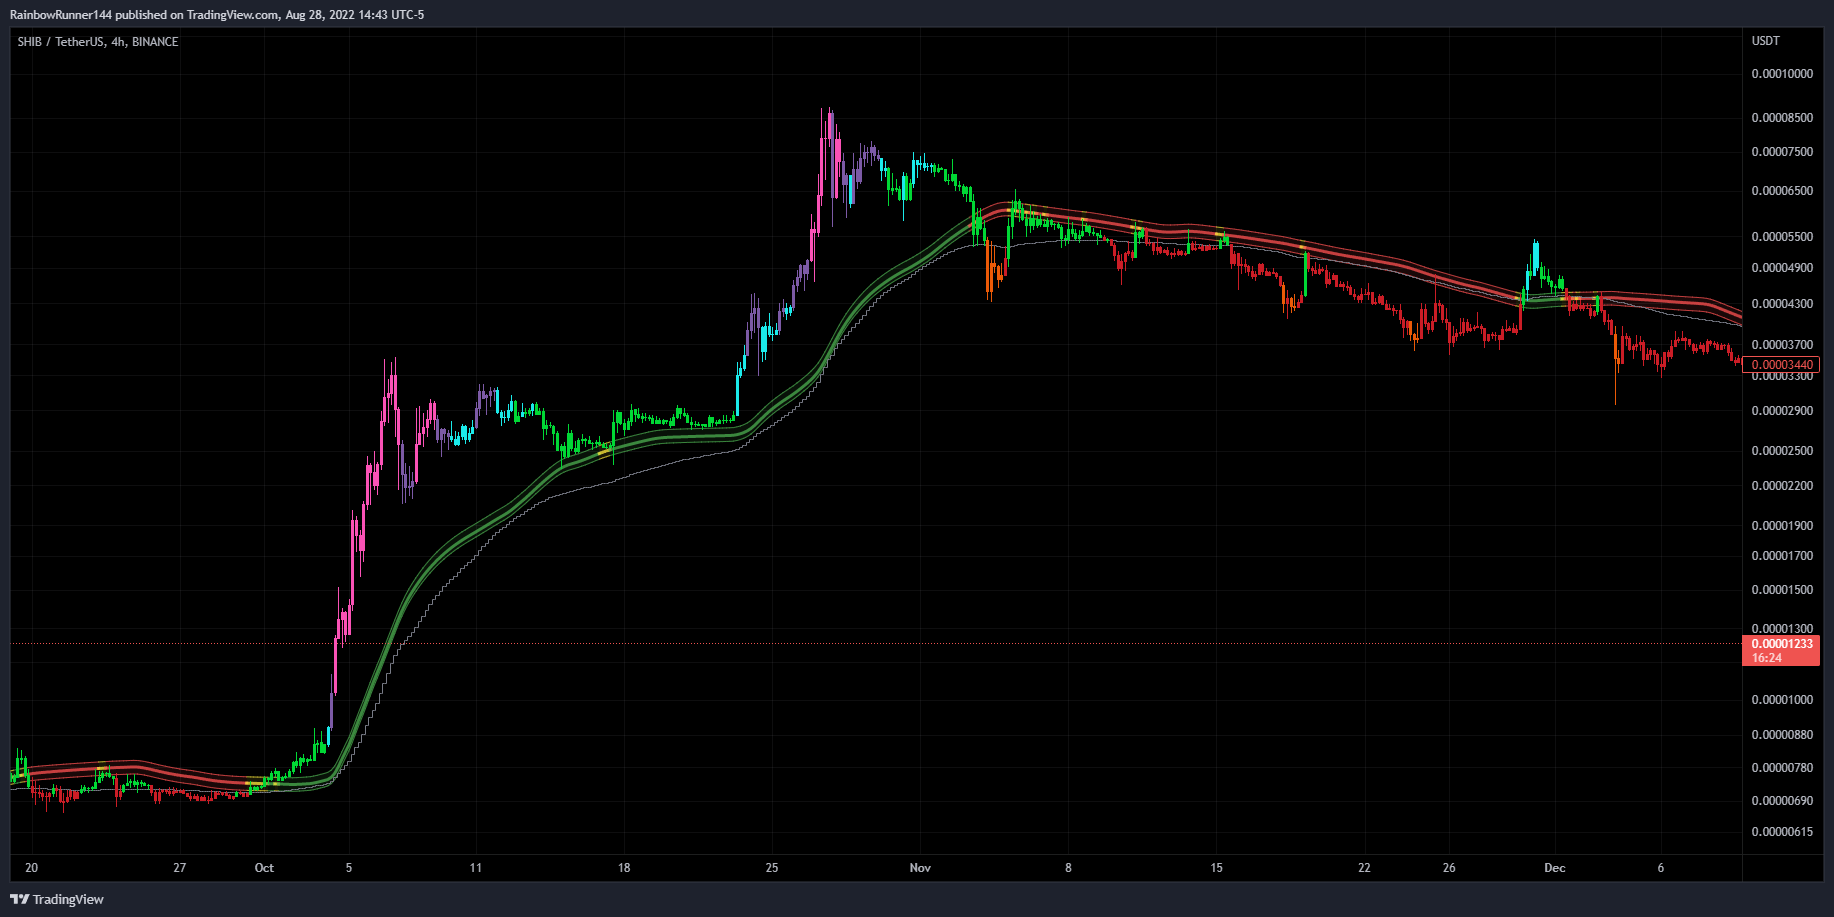
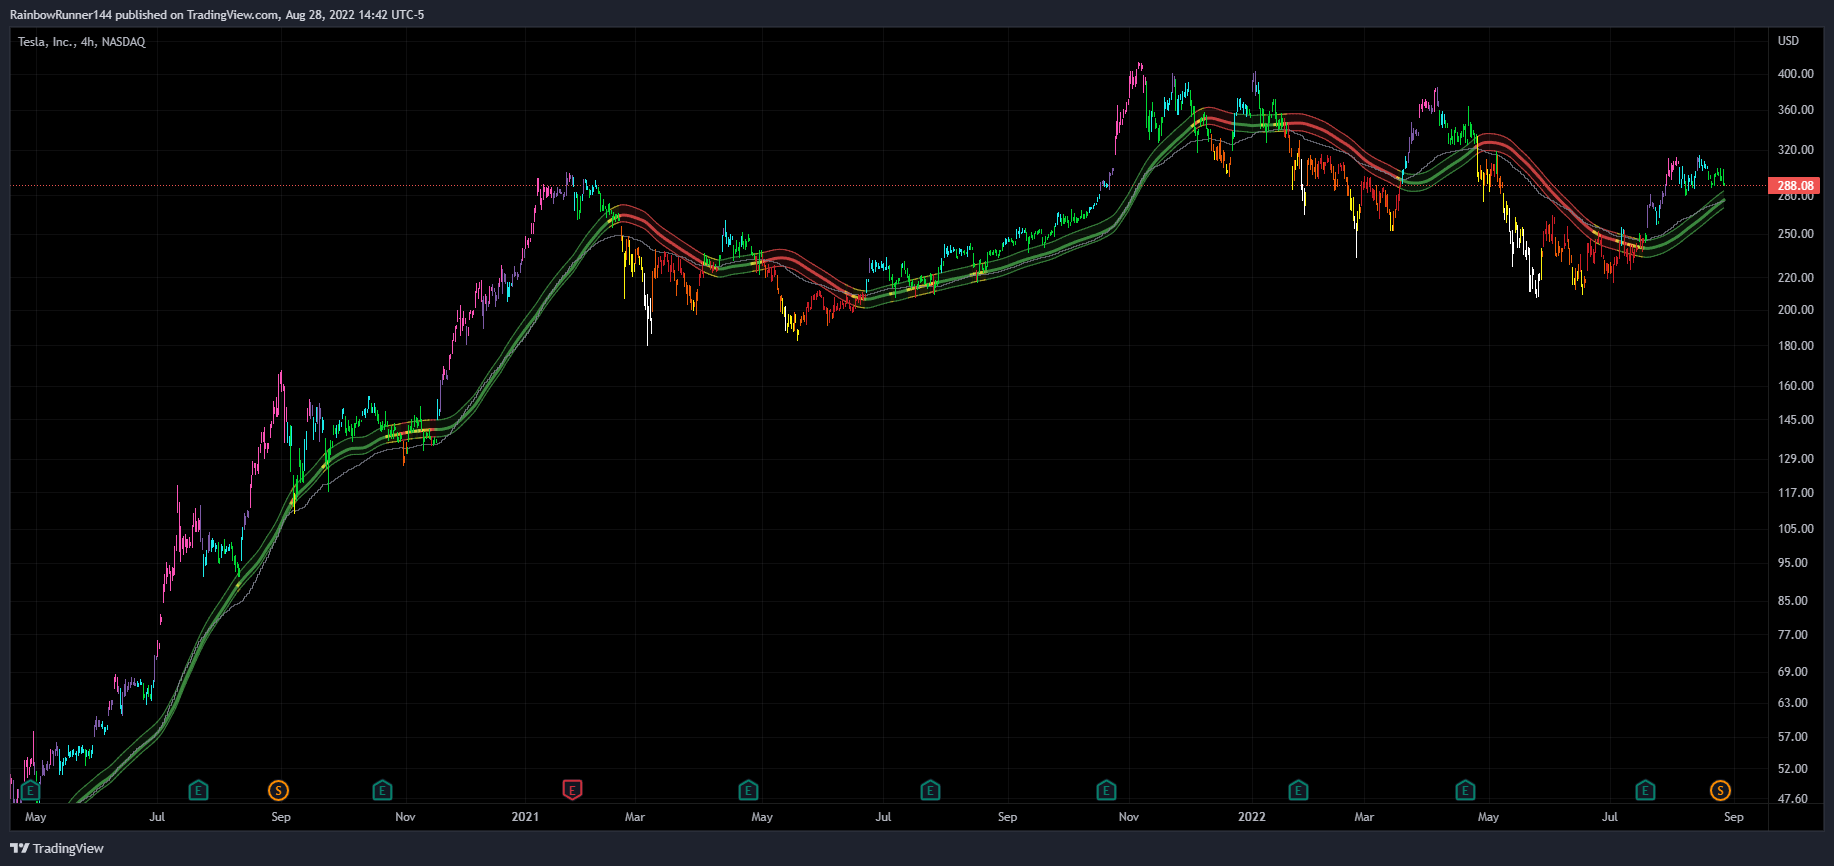
Channel Walker
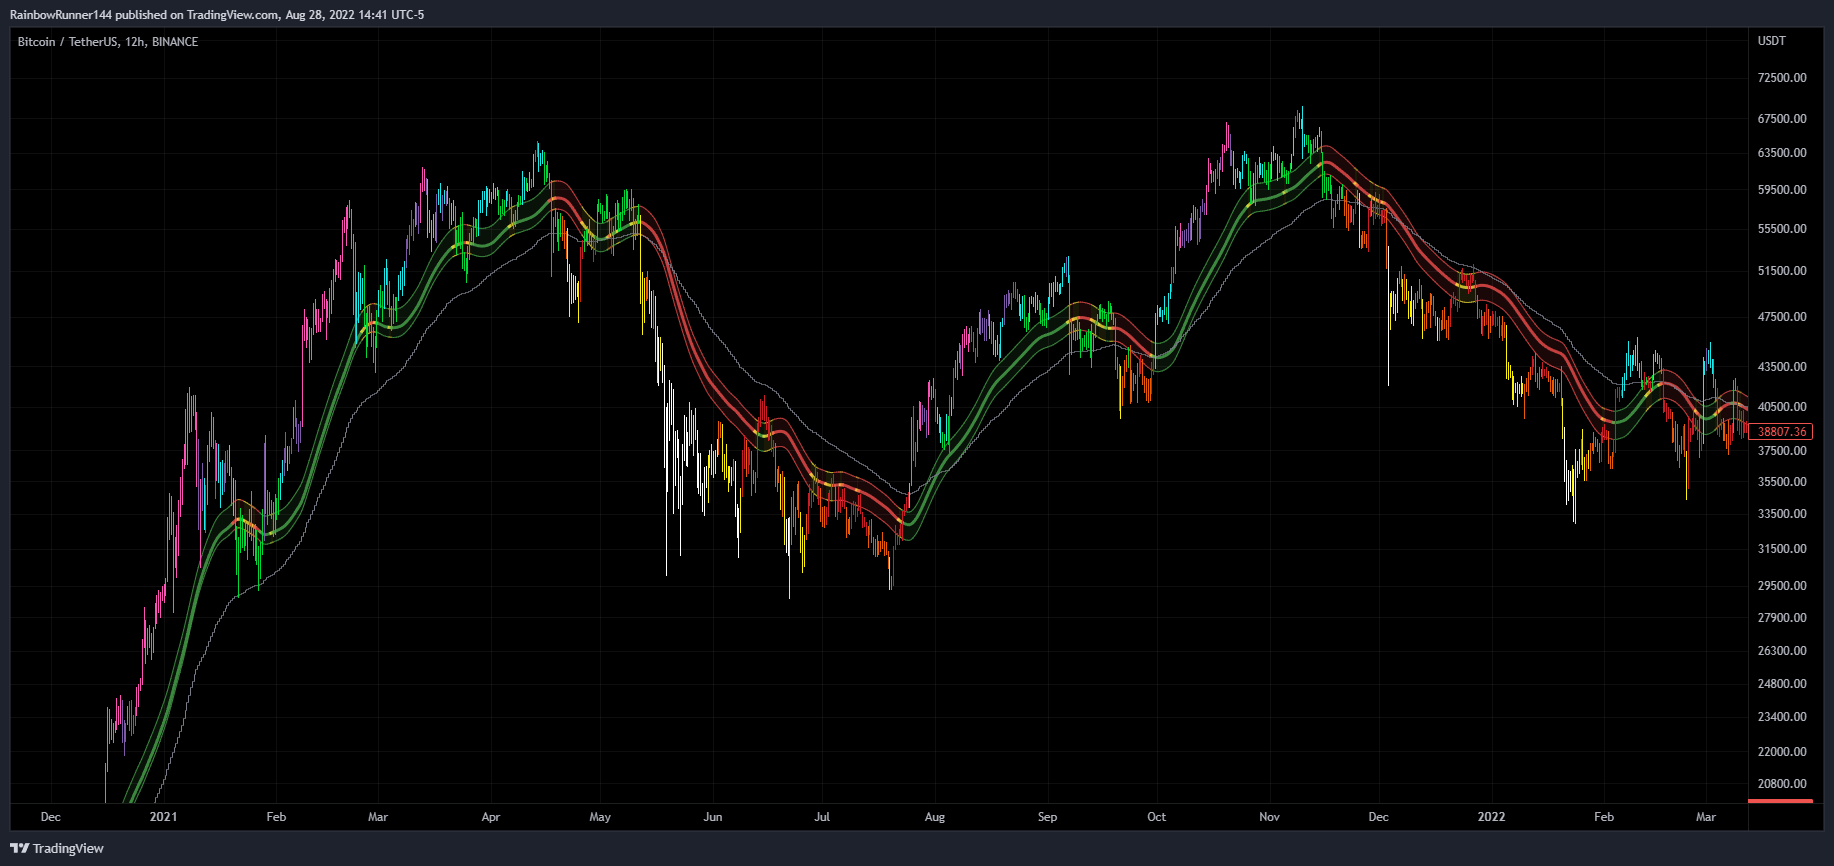
Rainbow Trends Channel Walker tool is a visualized take on support/resistance in regards to multiple trend analytics . This tool is specifically designed to assist traders to avoid FOMO and be patient with the price action. As with many of the other Rainbow Trends Tools, this tool is highly reactive to time and the colors become more important the higher the time frame.
- Bull Trends are displayed green.
- Crab/Pivots are displayed yellow.
- Bear Trends are displayed red.
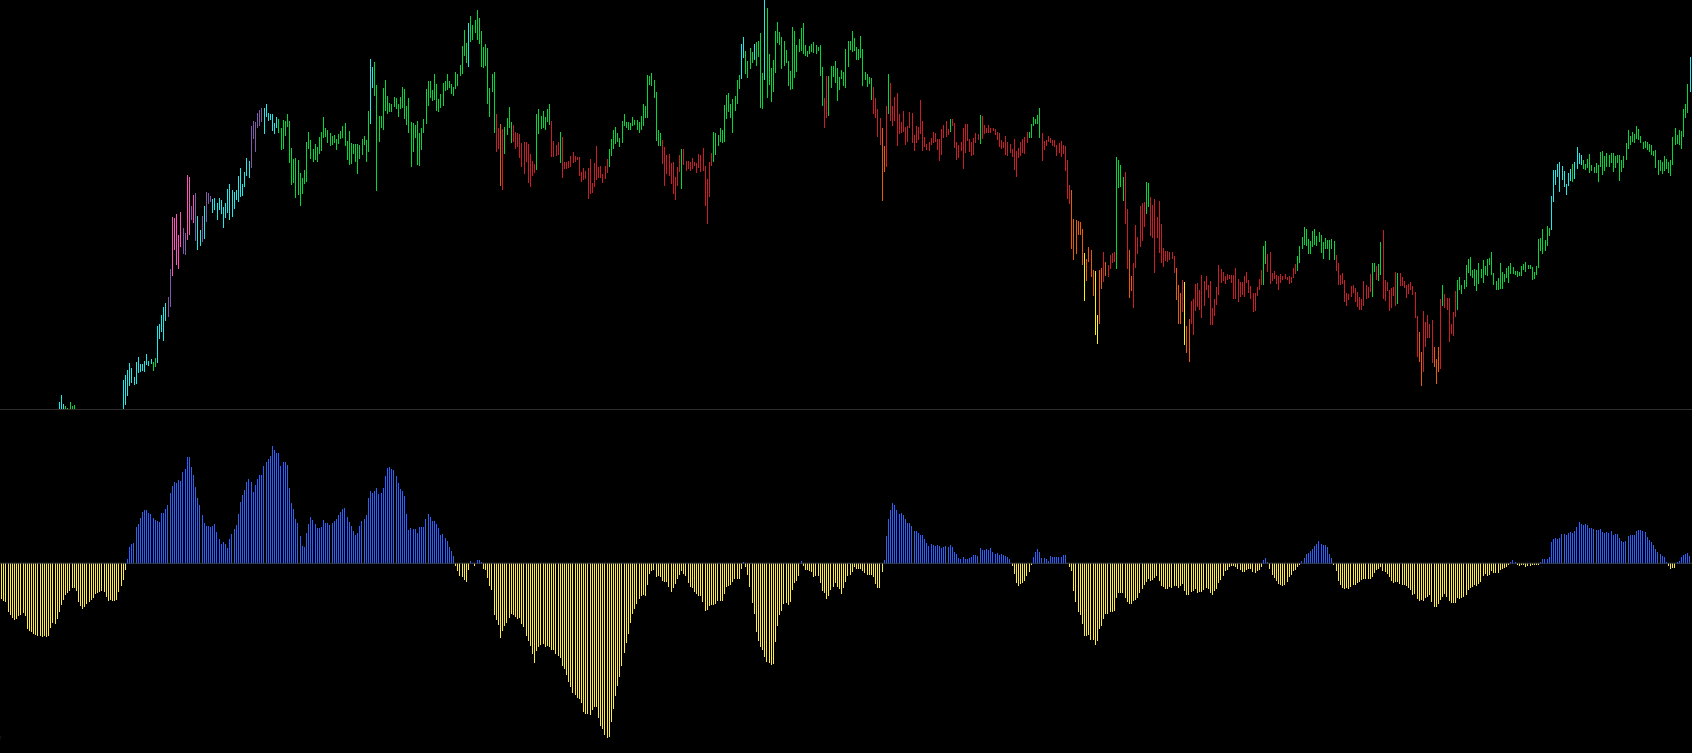
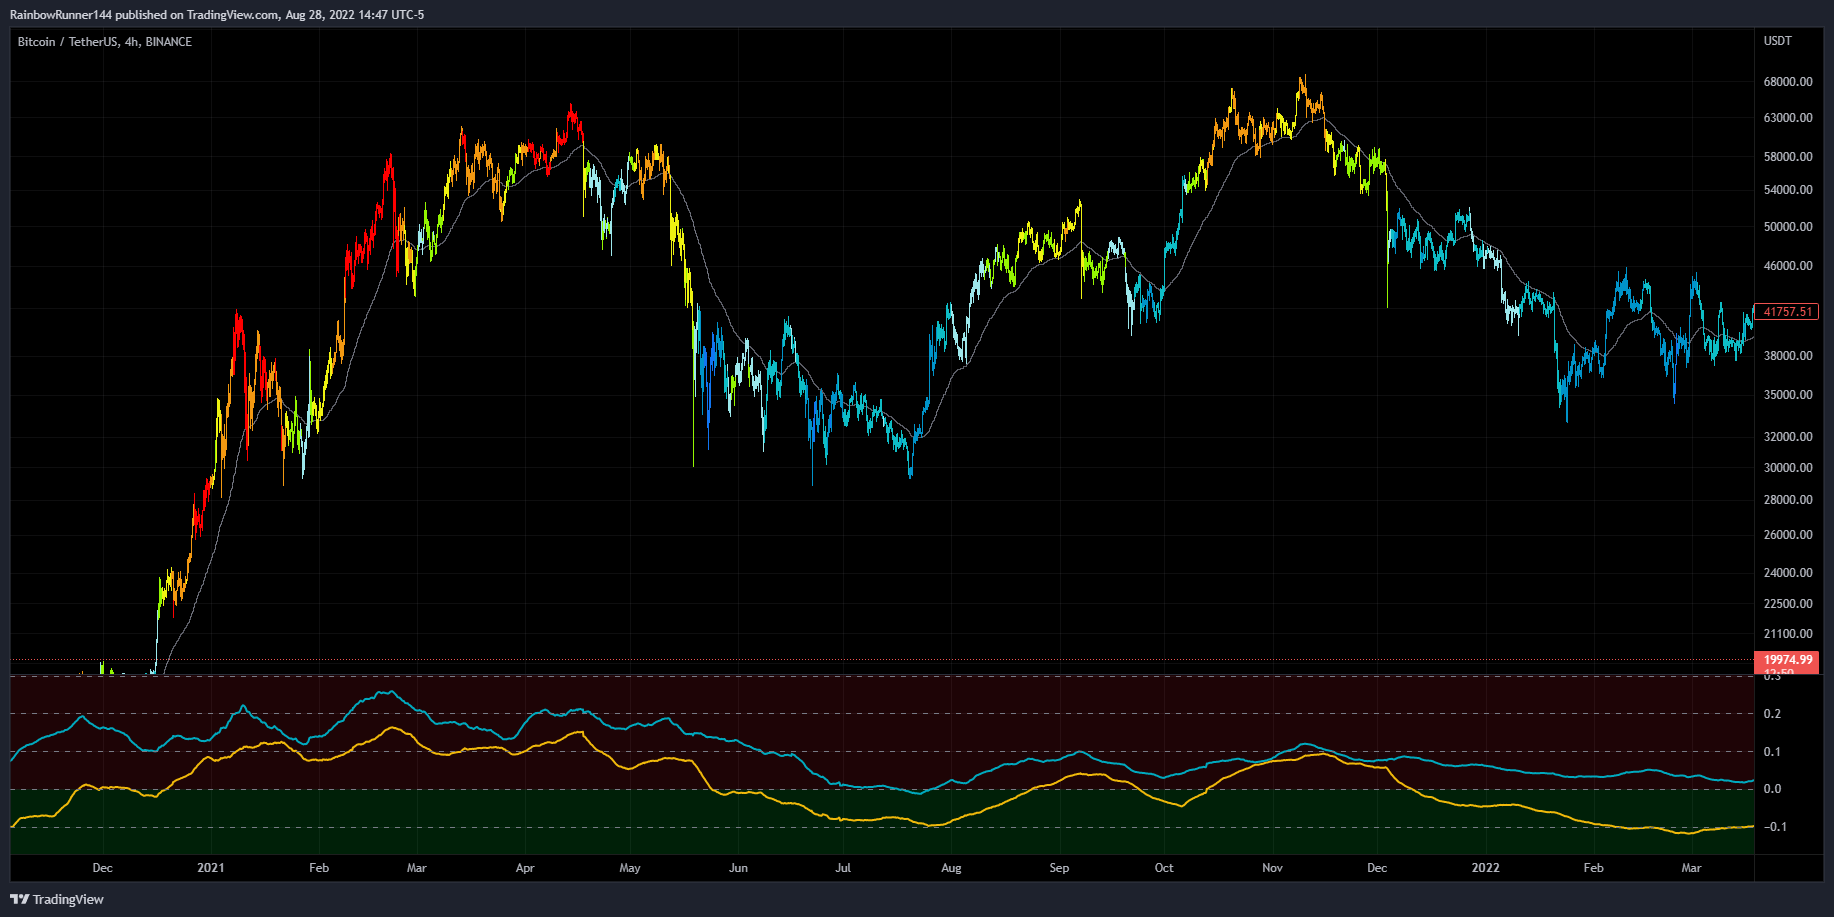
Developed by requests and input from our traders. This tool utilizes funding data directly from the Rainbow Funding Tool and converts it into a visual representation of candle colors that reflect the current bias of the Whales. In bull trends, whales pay a premium for leveraged positions. In a bear market, whales pay premiums for spot positions. This tool takes this data and displays it in a way that allows any trader to identify the hidden Perp vs Spot bias of the Whales.
Bullish /Leveraged Funding Scale:
- Dark Blue -> Blue -> Light Blue -> White
Bearish /Spot Funding Scale:
- Dark Red -> Red -> Orange -> Yellow
Bitcoin Funding Indicator
A tool developed from requests and input from our traders. This tool utilizes the funding data between Exchanges and converts it into a visual representations of the current bias of the Whales.
In bull trends, whales are willing to pay a premium for leveraged positions.
In a bear market, whales prefer to pay a premium for spot positions. This tool takes this data and displays it in a way that allows any trader to identify the hidden Perp vs Spot bias of the Whales.
Custom Ichimoku Clouds
The Rainbow Trend Indicator works very well with the Ichimoku Cloud. This custom indicator allows you to easily one click switch between Standard, Josh Olszewicz, and Custom Cloud settings. This indicator also has ON/OFF options to display the entire Ichimoku Indicator or just the clouds for when you want to use it on top of the Rainbow Trend Indicator.

